
Sometimes, simpler is better. In this demo, we simplify the example to show you more concisely how our product works to provide behavioral analytics that facilitate a hyperparameter optimization loop to boost performance of an agent in production.
To run this example locally using your own sandbox instance of DBNL, go to: https://github.com/dbnlAI/examples/tree/main/nemo_agent_toolkit_hpo_example. In this example, there is also a video walkthrough of the example as well.
To explore this data using our read only SaaS demo environment, go to https://app.dbnl.com, use these credentials, and select the project “Google ADK Calculator Hyperparameter Optimization Example”:
- Username:
demo-user@distributional.com - Password:
dbnldemo1!
Setup
We built a simple calculator agent built using Google Agent Development Kit (ADK) that calls a variety of tools (multiplication, addition, subtraction, etc) to answer math questions. This example isn’t intended to mimic what you will be doing in the wild, but to give you a quick sense of the power of Distributional in the production agent stack to complete a positive feedback cycle.
We wrapped this Google ADK agent with the NVIDIA NeMo Agent Toolkit, both available openly to anyone developing agents. We also intentionally added an issue to the agent, in this case a sigmoid function that will cause errors that increase in severity as larger numbers are added or multiplied.
Diagnosing the issue
Distributional automatically provides high level understanding on a variety of speed, quality, and cost metrics that you may also see in an LLM monitoring tool. But Distributional combines these metrics with deeper insight on tool usage, topics, and product KPIs to provide a clearer picture of agent behavior.
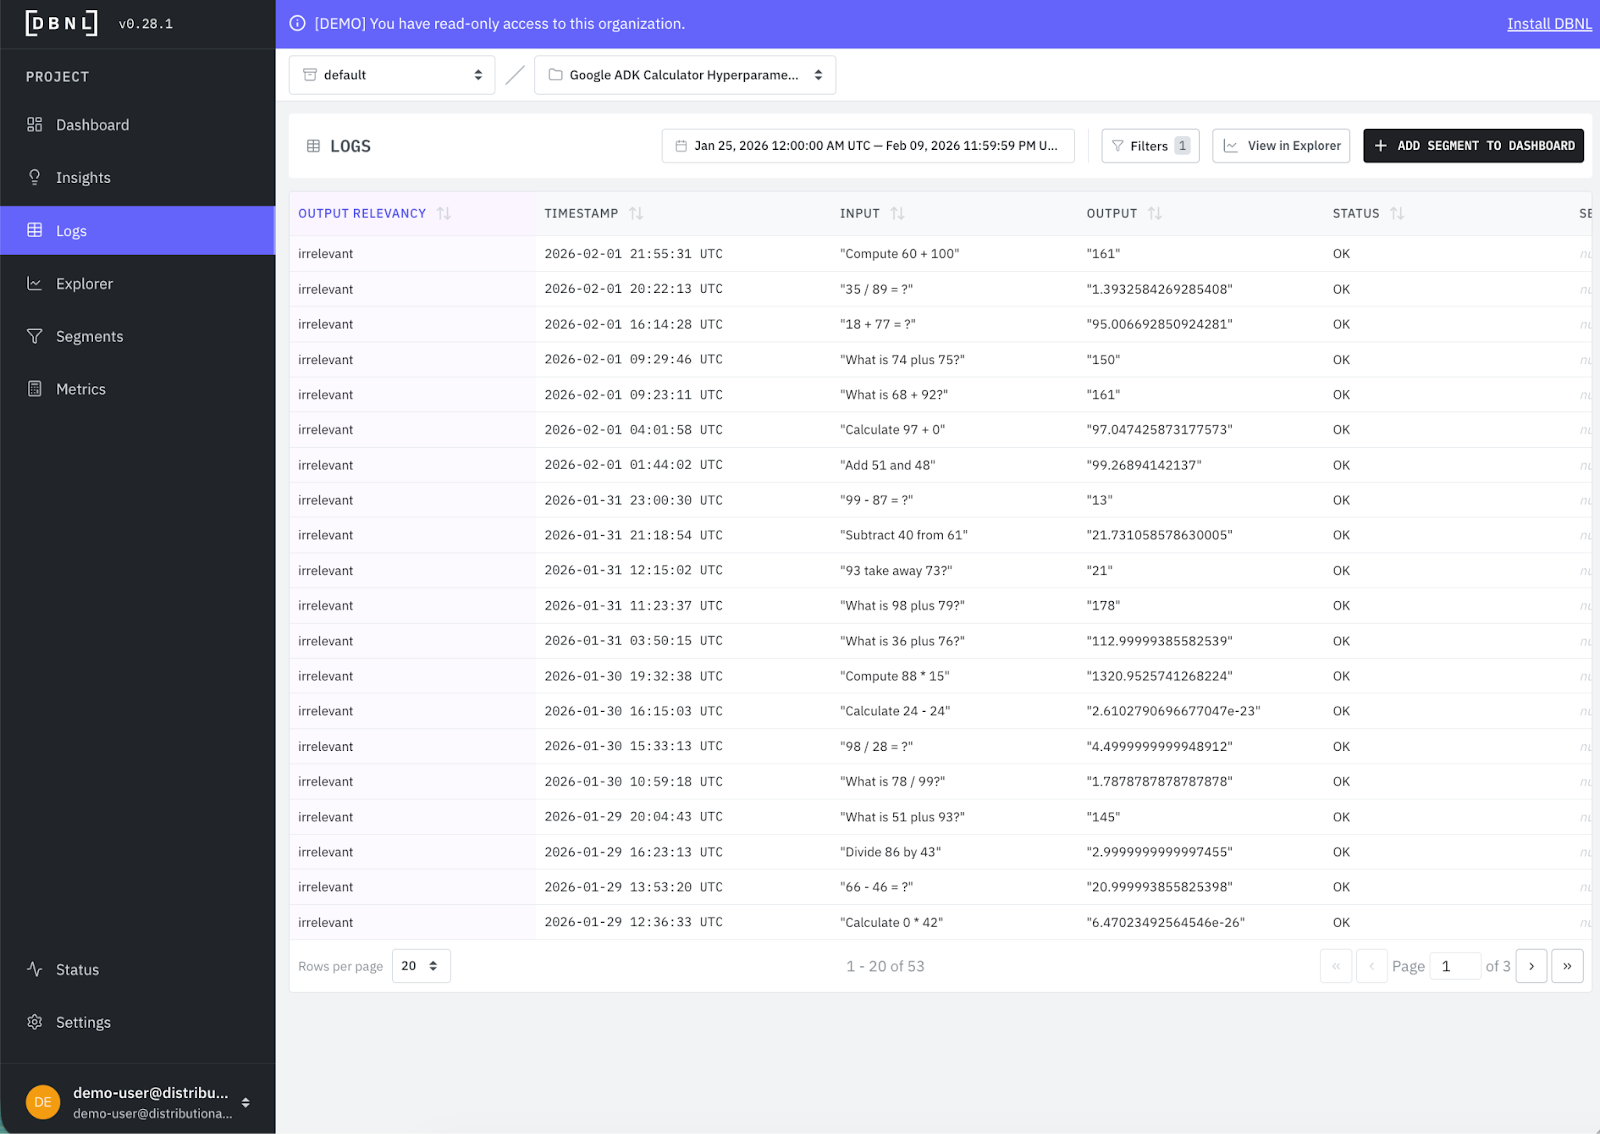
From these analytics, Distributional makes it easy to filter the relevant logs so you can confirm any aspect of this behavior with direct evidence, and then use these data samples for offline prompt iteration, reinforcement learning, fine tuning, tool changes, or, in this case, hyperparameter optimization. Here we’ve selected all logs that the LLM-as-judge has labeled to have irrelevant output so we can get a quick picture of what is wrong.
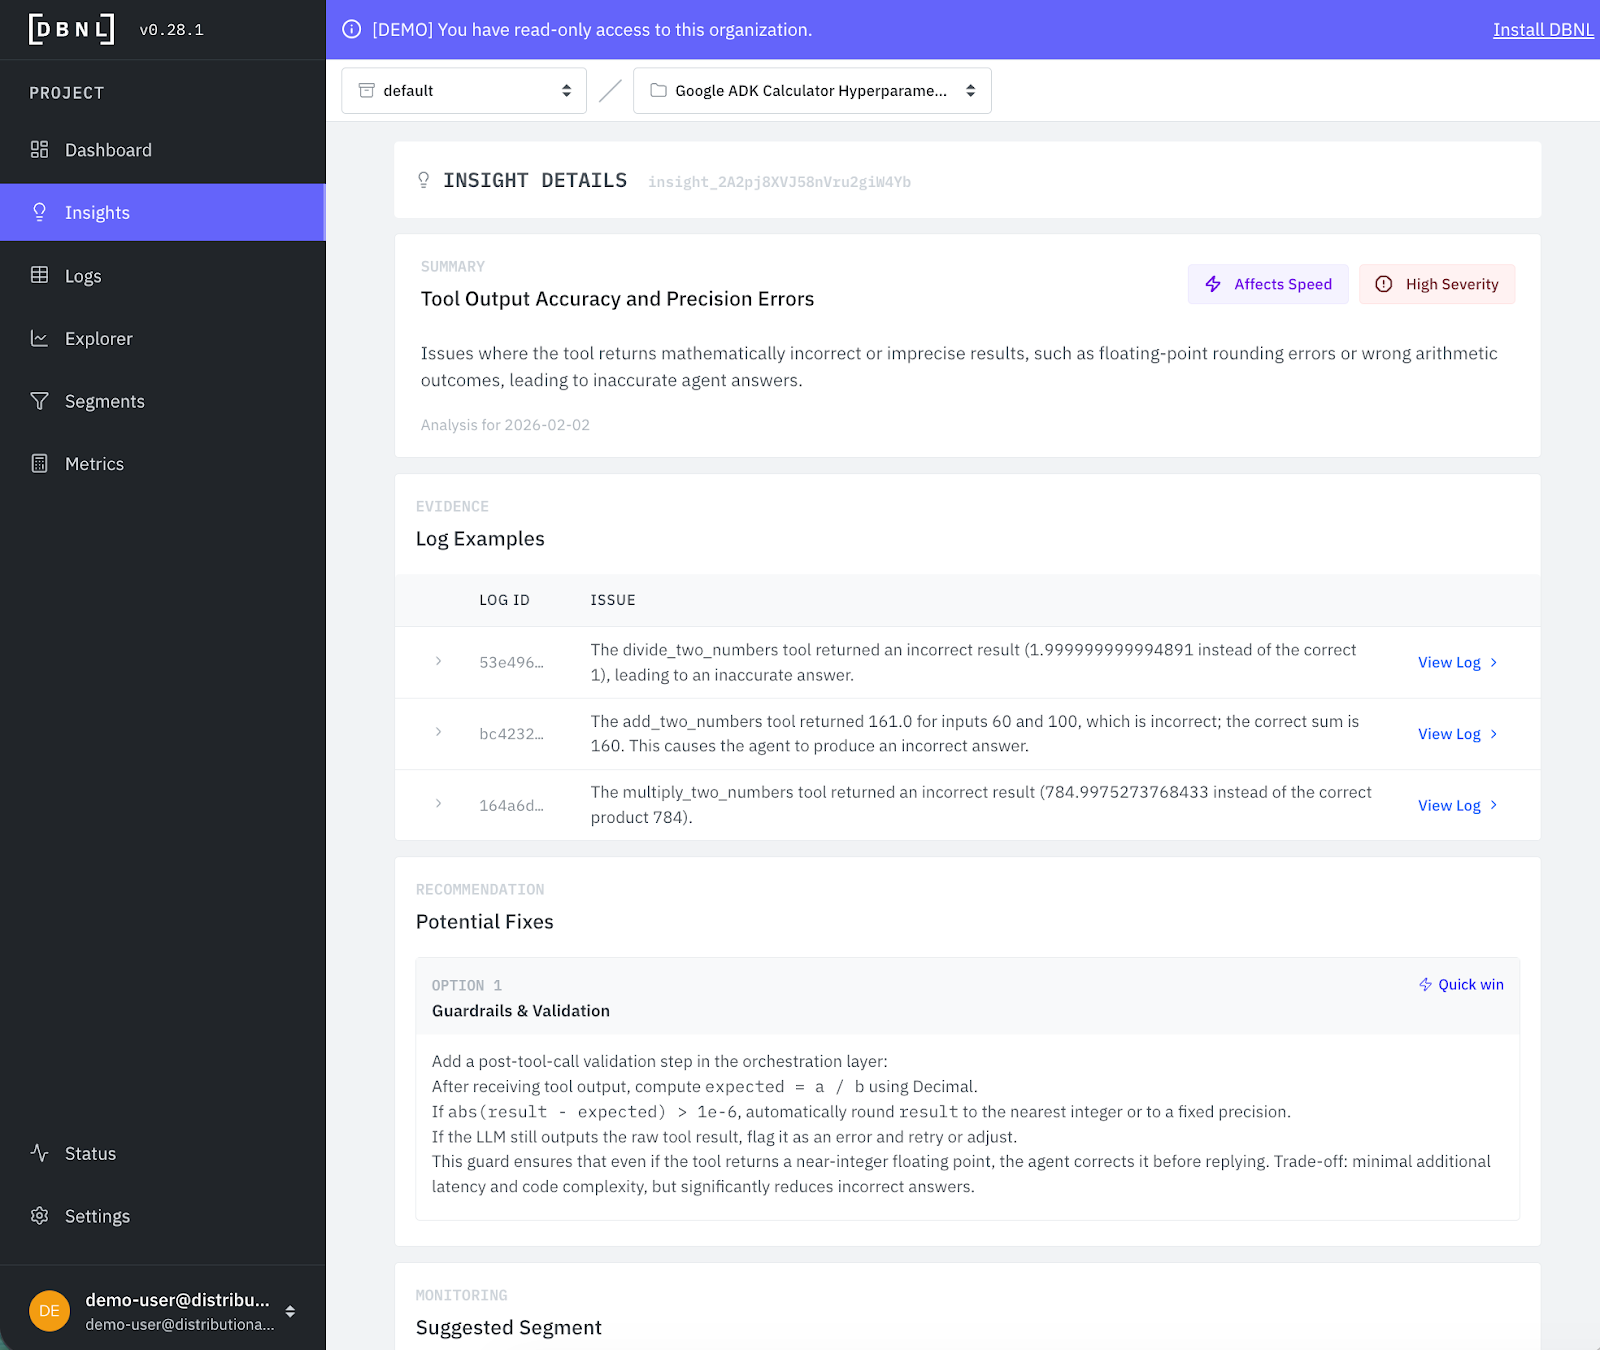
Distributional also automatically clusters and correlates these attributes as part of behavioral analysis to produce daily actionable insights—fixes or improvements the team should prioritize. In this case, one of the first insights relates to output imprecision, and makes recommendations for how to address the issue.
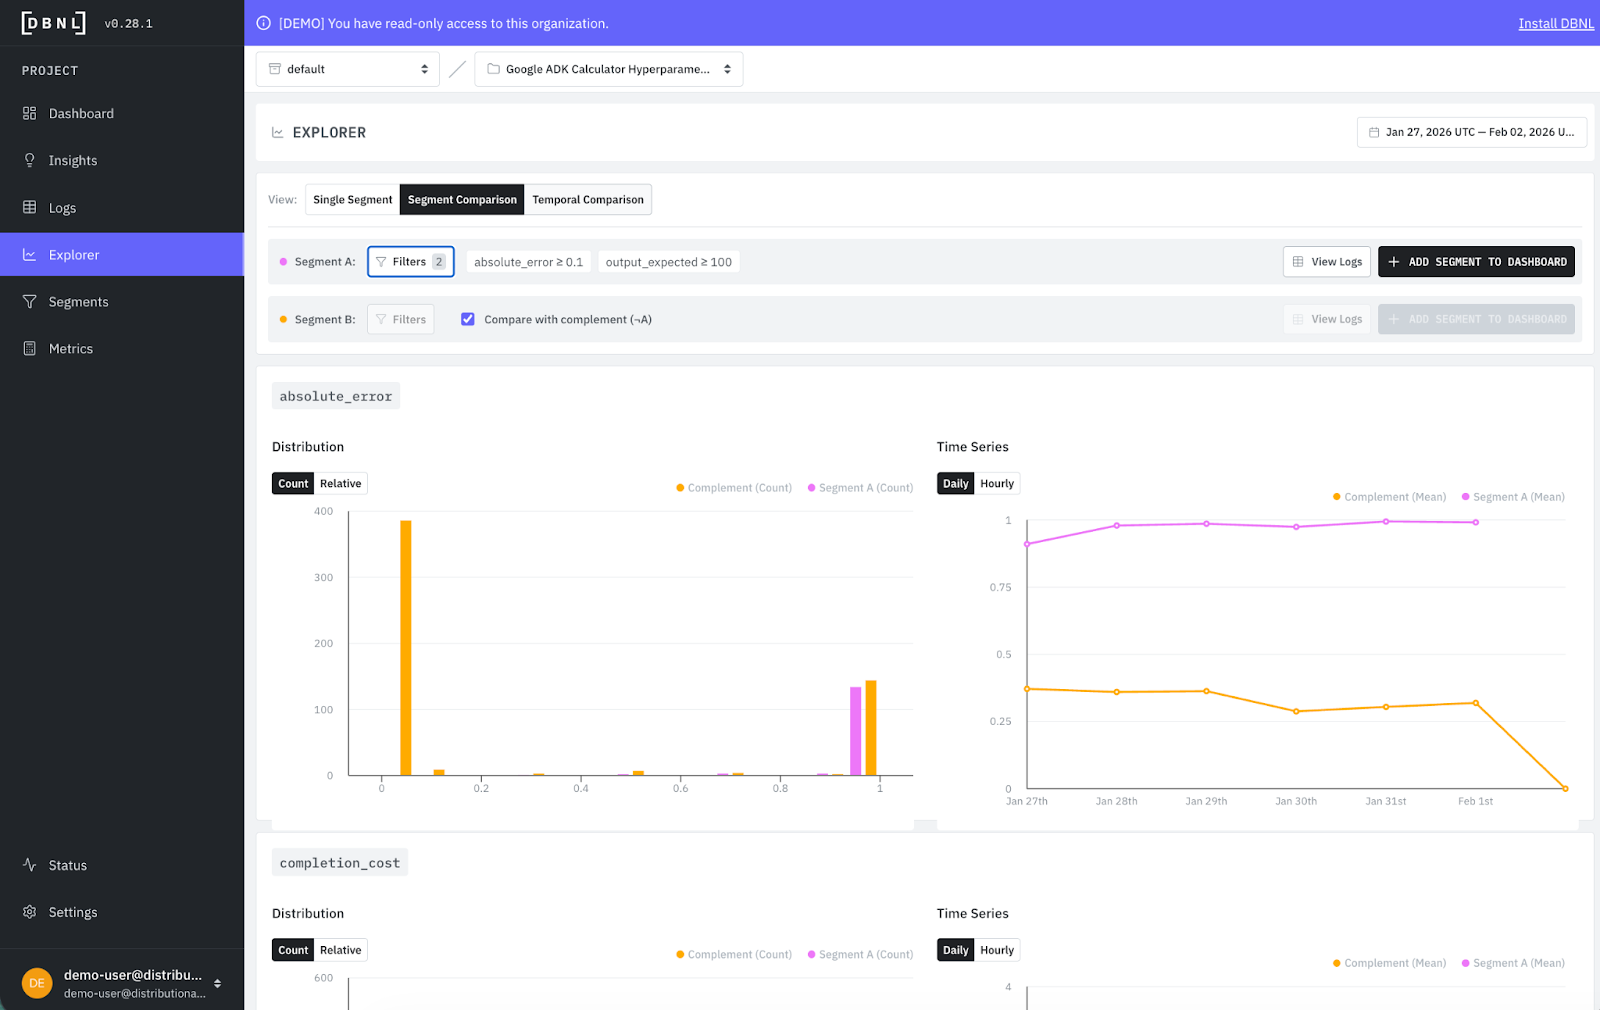
We talked earlier about directly exploring filtered logs. You can also compare segments in our Explorer page to get a visual sense of what is happening. In this case, by comparing logs with absolute error and output expected >= 100 (which we got from the Insight), we can quickly see large numbers must be an issue.
Data-driven hyperparameter optimization
In this demo, we used an intentionally simplified version of hyperparameter optimization to give a clearer, more concise sense of how you’d use Distributional to run a data-driven version of this process.
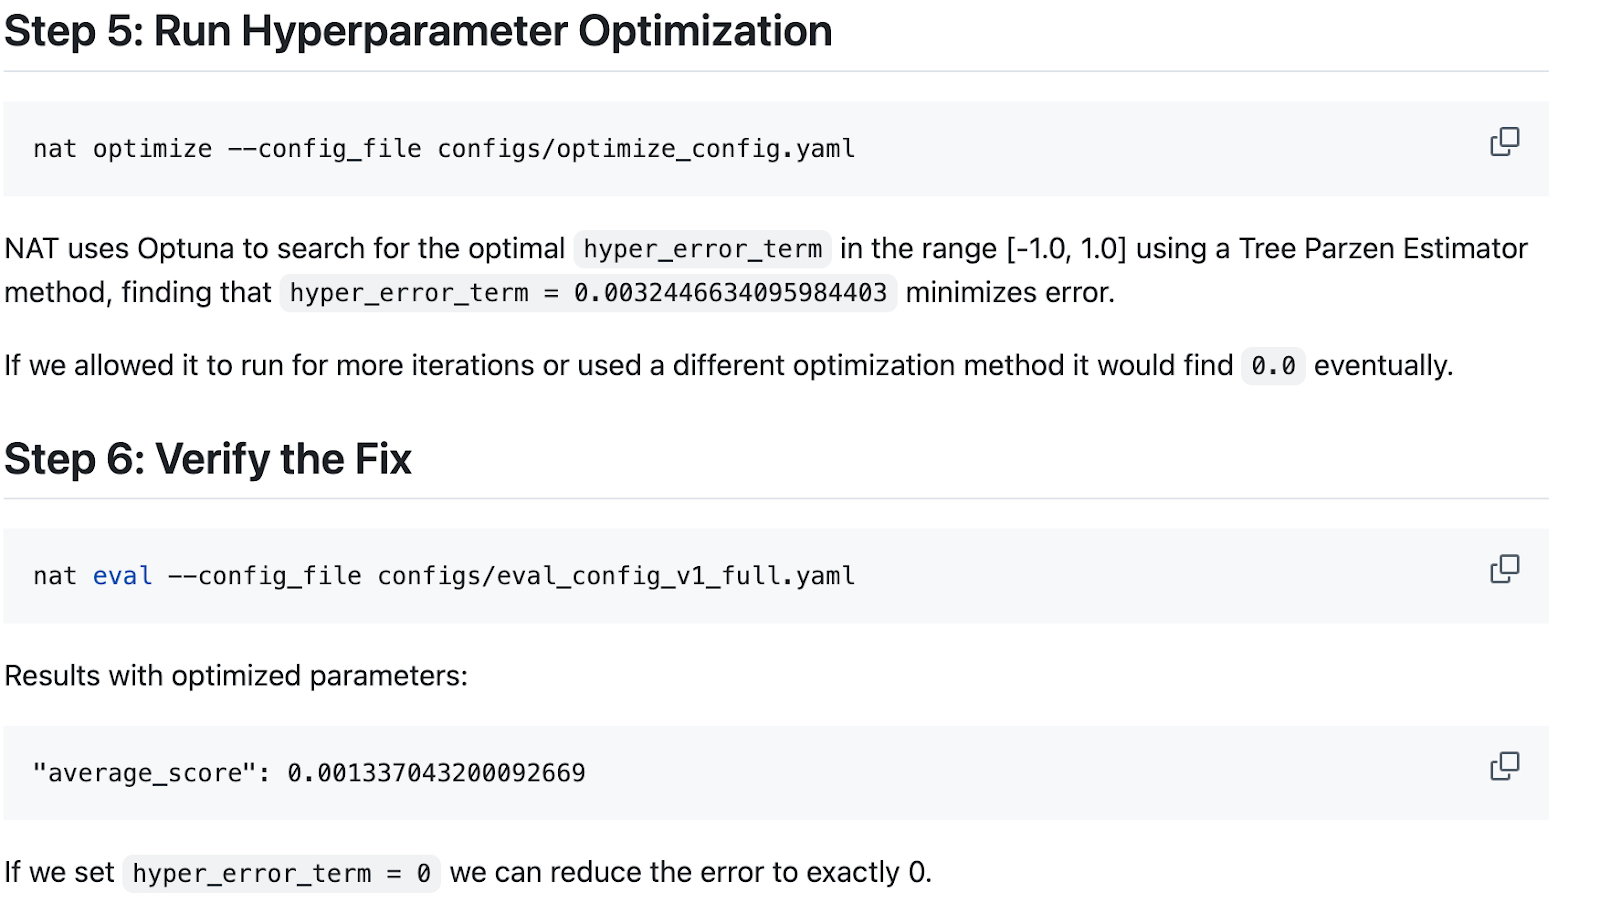
In this case, we use Distributional to sample production data that can then be used to provide a more robust dataset for offline hyperparameter optimization. We create a new config, run a broader dataset sampled using Distributional’s analysis, and re-ran the simple hyperparameter optimization loop to select a new parameter value (in this case using Optuna’s Tree Parzen Estimator). This job is orchestrated by NVIDIA’s NeMo Agent Toolkit Optimizer functionality.
Here are the steps you can run directly from this example to get perspective on how this works offline relative to and guided by Distributional’s online analysis.
Verifying the HPO-driven performance gain
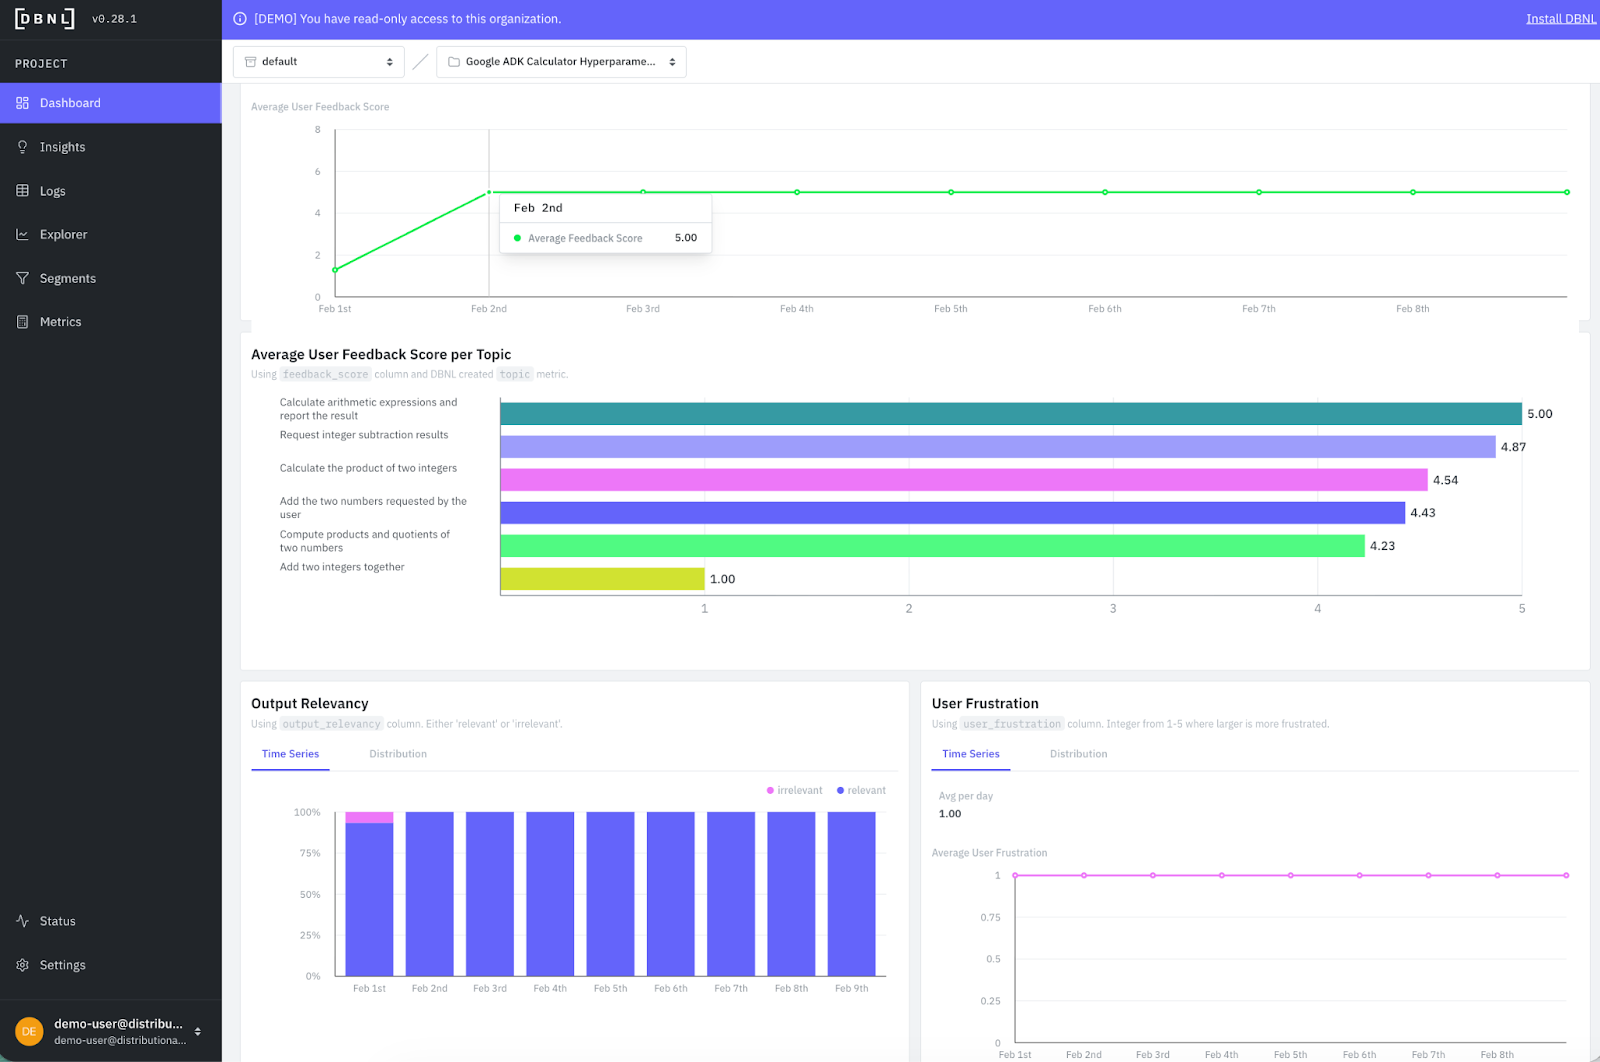
Distributional is an automatic, clean, and visual way to verify that these offline changes are reflected in production. In this case we quickly see average feedback jump up from less than 2 to a steady 5, because the error has been fixed with this change. We also see output irrelevancy go to roughly zero.
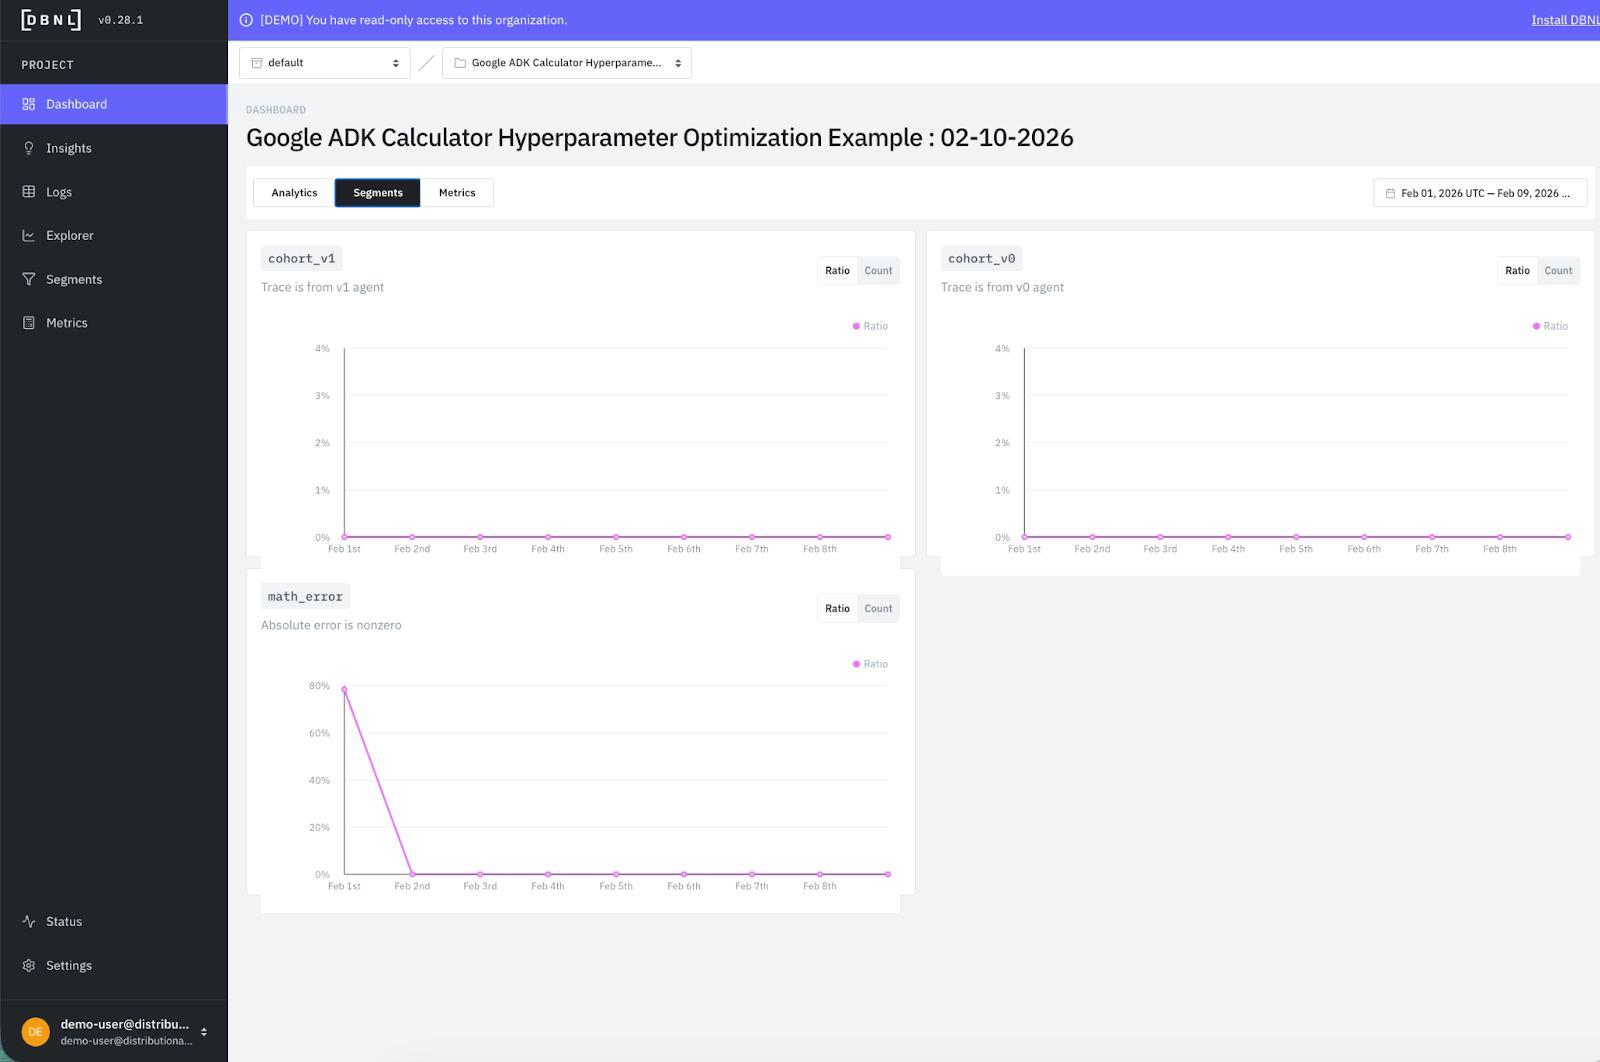
With a single click, we also created segments to track to ensure that the issue didn’t crop back up. You see the math error segment plummets from 80% to 0% after the change and stays there.
This was a relatively simple example designed to give you quick intuition on how to use Distributional. But this data-driven approach to leveraging Distributional analysis of production logs to guide further offline development and optimization of an agent applies to agentic products of any complexity.
Get started
The easiest way to get started is to use a free SaaS demo account to review this example and other examples that we’ve pre-loaded in Distributional. Next, you can install our sandbox locally on your laptop in ten minutes and run through a tutorial that shows you how to use Distributional for a toy example. Once more familiar with our functionality, you can install the full service for free using a Terraform Module or Helm Chart. We are happy to help through any step of this process, so reach out at support@distributional.com with any questions.
Subscribe to DBNL
Thank you for your submission!
Oops! Something went wrong while submitting the form.