
“First, it was hard to find the issue with our AI agent. We saw feedback dip and then usage drop, but didn’t know why,” explained an AI engineer at a large insurance company. “Next, it took our engineering team an entire week (1 engineering month) of work to actually diagnose the root cause of the issue and make the change.” They continued, “Finally, we weren’t actually sure that the change fixed the issue, and still aren’t today – we saw feedback improve and usage has slowly started to crawl back up, but both may be disconnected from the actual problem.”
We’ve heard the same story from dozens of AI product teams: it is hard to discover and diagnose issues when your agent is in production, and can be even harder to confirm the fix is working. These stories motivated our approach to adaptive analytics. In this example, we show how you can solve each of these problems with Distributional’s product (DBNL) to have a much more rapid cycle of fixes and improvements for your production AI agents. To jump straight to the example and start using it, navigate here: https://github.com/dbnlAI/examples/tree/main/ab_test_example
In this short demo, you will learn how to:
- Automatically discover new issues with your AI agent
- Rapidly analyze the issue to uncover the root cause
- A/B test a fix to be confident it solved the issue
- Track the fix to make sure it doesn’t reappear
Scenario
To simplify this example, we built an LLM-based calculator agent that calls tools to add, subtract, multiply, and divide numbers. We generated a wide variety of math strings and ran these as queries to this calculator. We then intentionally introduced a bug in one of the tools for DBNL to automatically discover. We logged these traces and augmented them with a variety of properties:
- Expected value: Value we would expect when performing the calculation
- Simulated Feedback: Thumbs up or down from the user and feedback text
- Version: Extract the version of the agent to facilitate A/B testing of fixes
- Absolute error: Difference between expected and actual output
- Cost: Tokens and estimated cost
We ran this calculator for 7 days with synthetically generated queries, at which point DBNL began producing daily insights on cost, quality, speed, and usage of the agent. (Typically AI product teams backfill with historical data to get started with DBNL much faster.)
Understand usage
DBNL makes sense of production AI logs with analytics that tell a deeper, more complete story on cost, speed, quality, and usage of the AI agent.
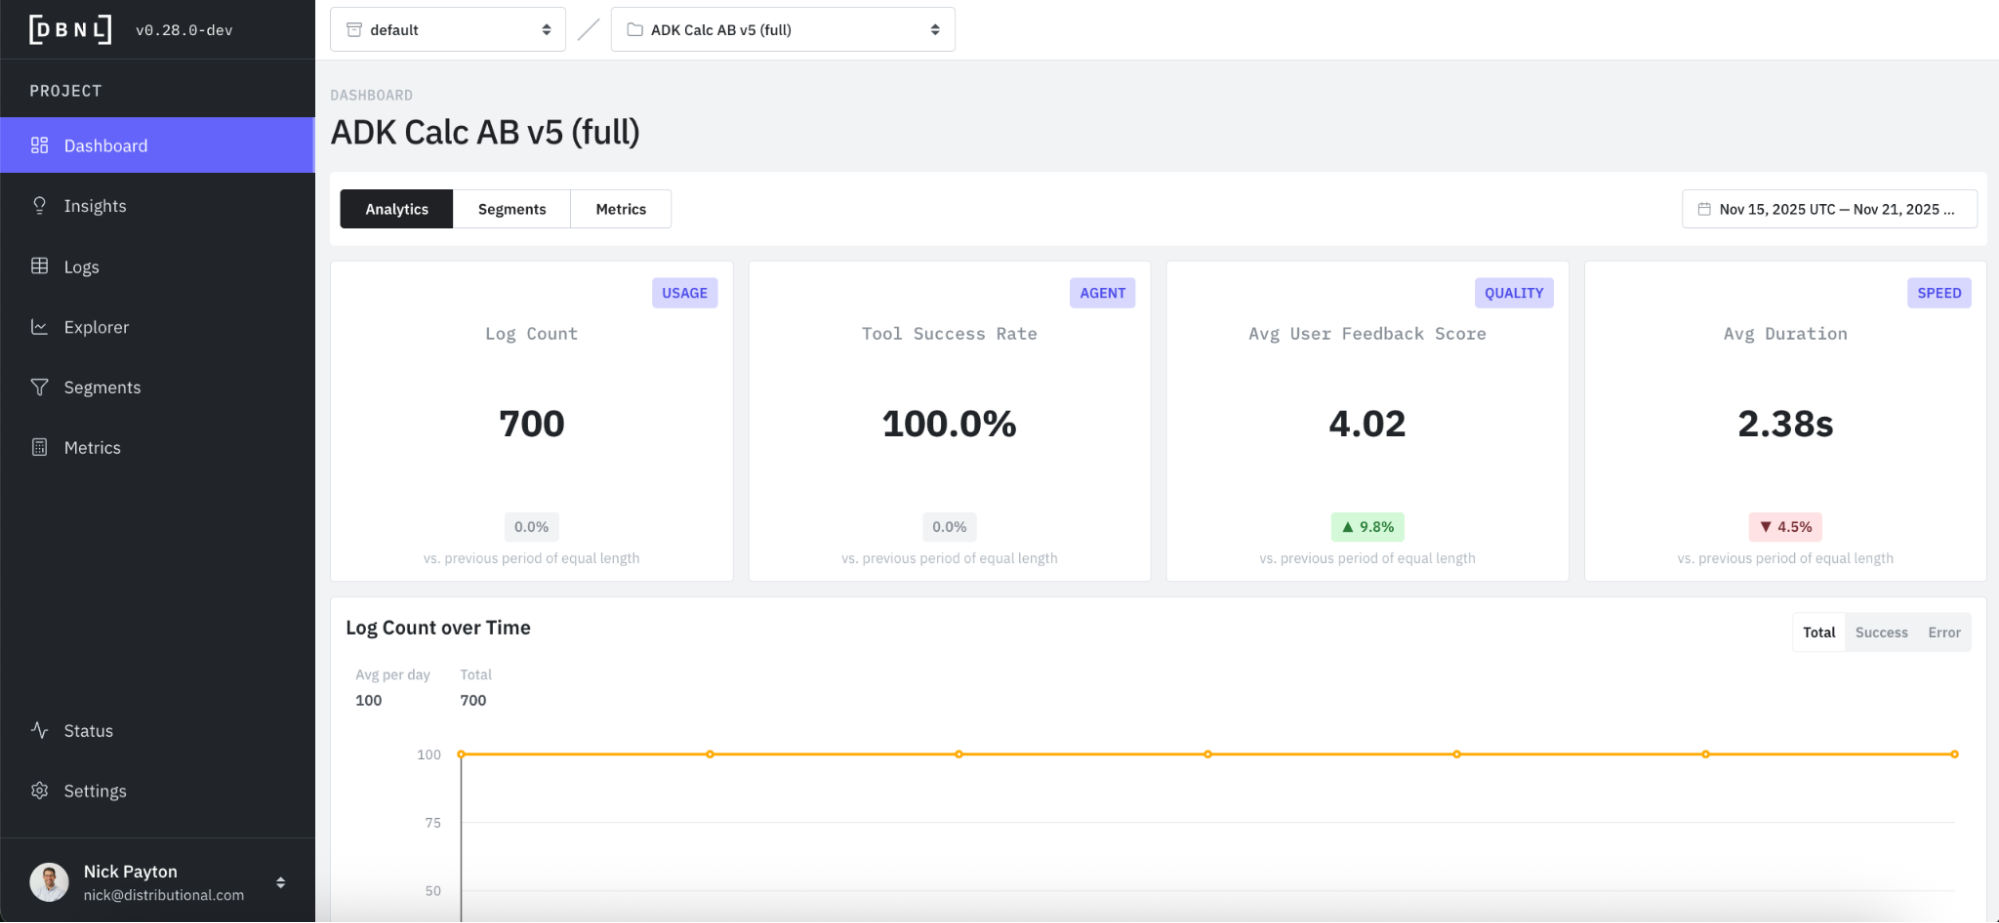
At the top of the DBNL Dashboard is a collection of high-level KPIs. In this case, we track user feedback as our product KPI and an indicator of whether someone is getting value out of the calculator or not. Immediately, we see something that may be worth investigating, which is a dip in average user feedback score and a lower score (3.76 on a Likert scale of 1 - 5) than we expected.
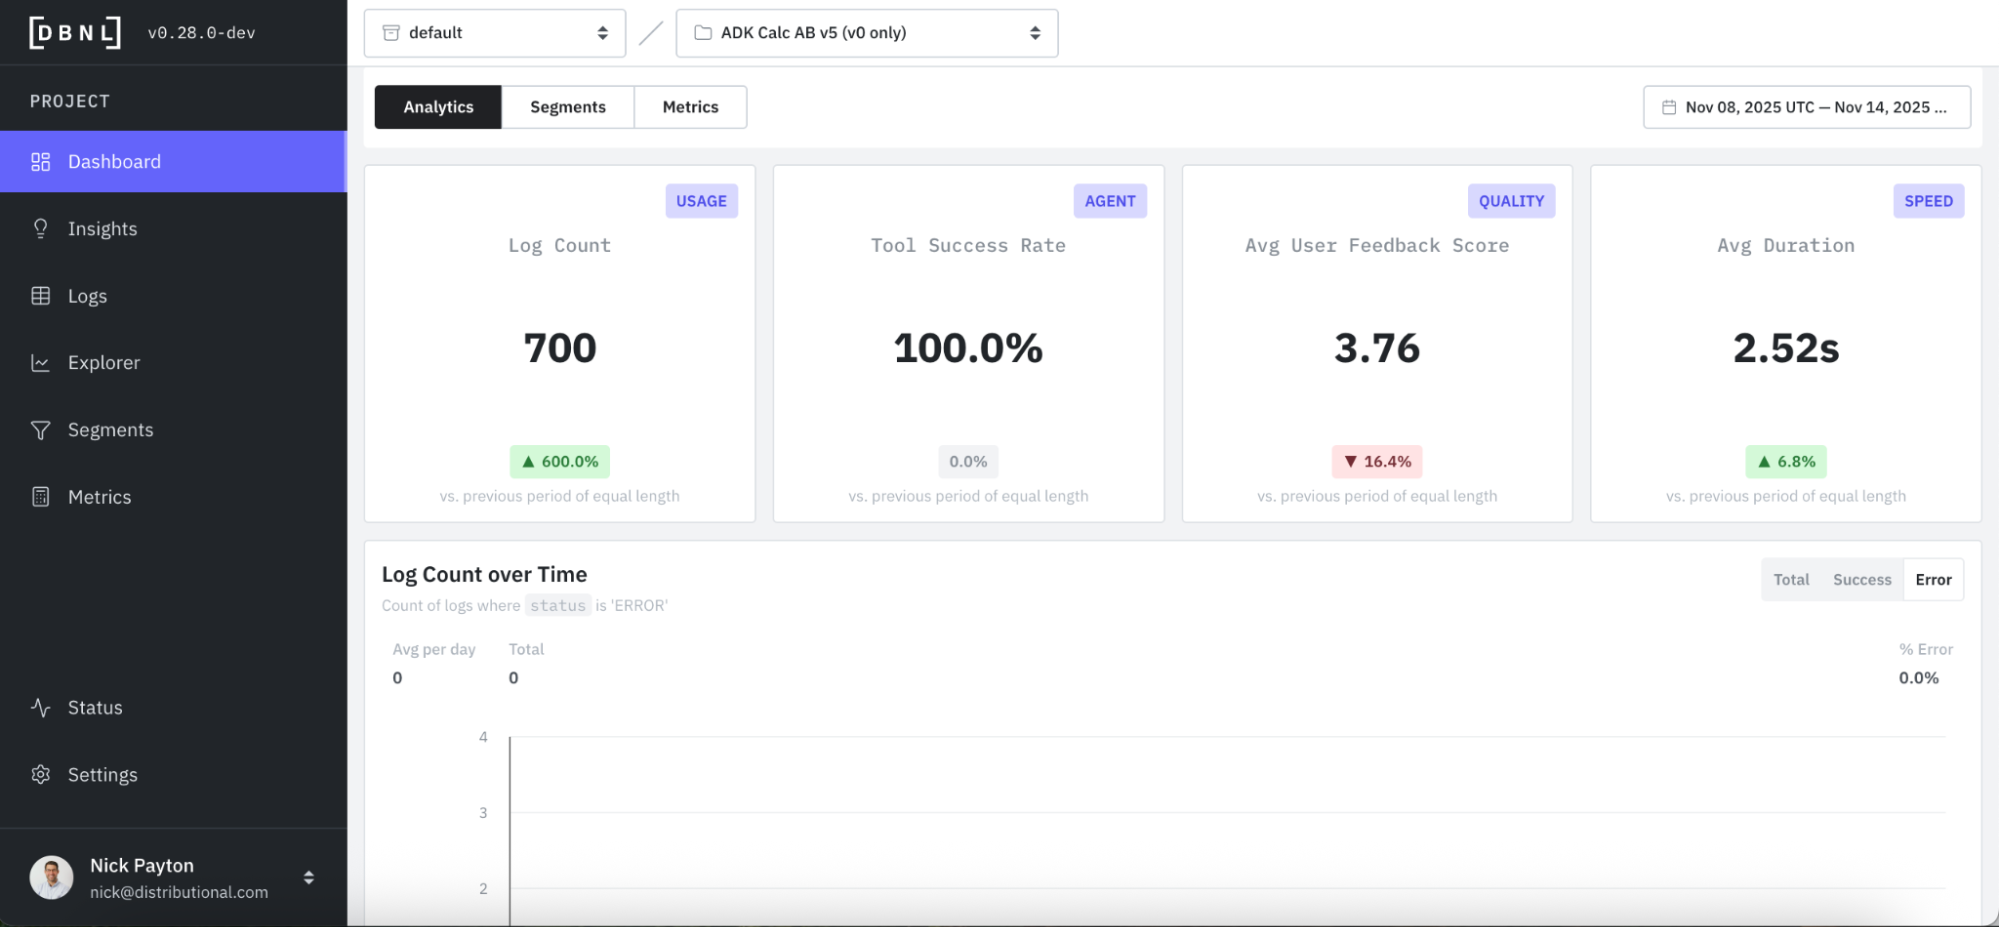
DBNL automatically computes standard and LLM-as-judge Metrics like Output Relevancy and User Frustration to give a sense of the quality of user experience over time.

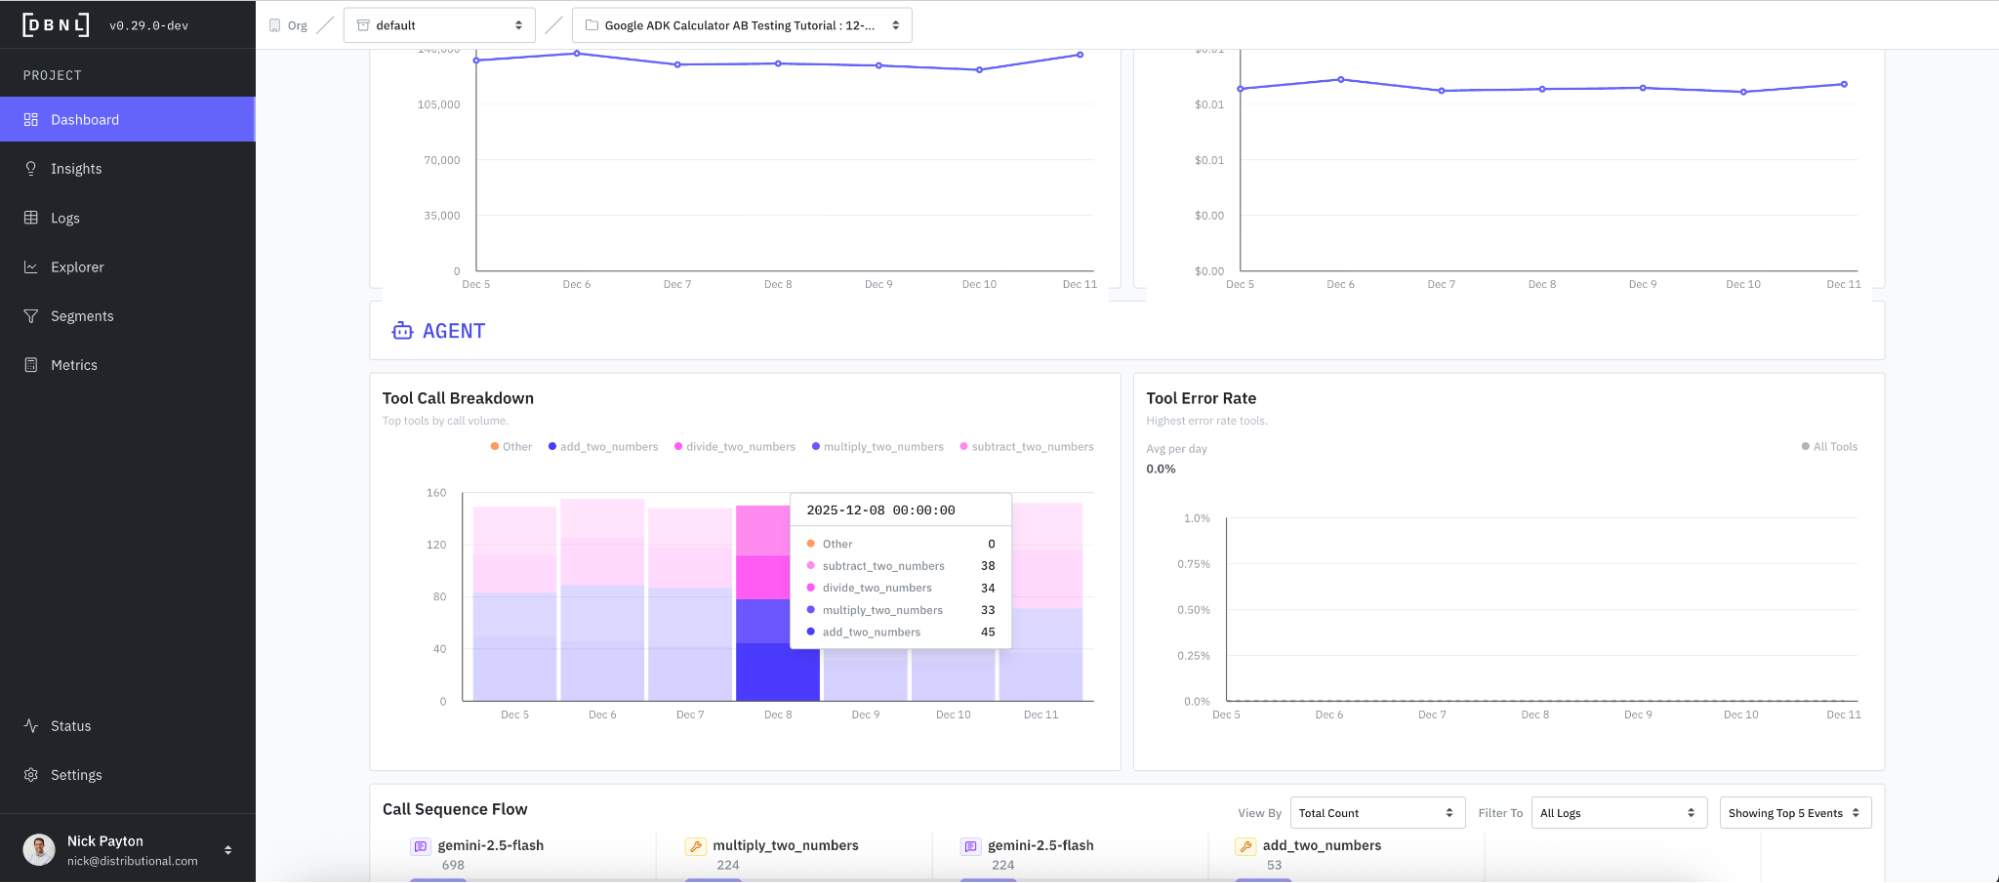
DBNL also tracks tool calls for an overarching sense of how the agent system is working so you can get a quick sense of whether this is in line with expectations.
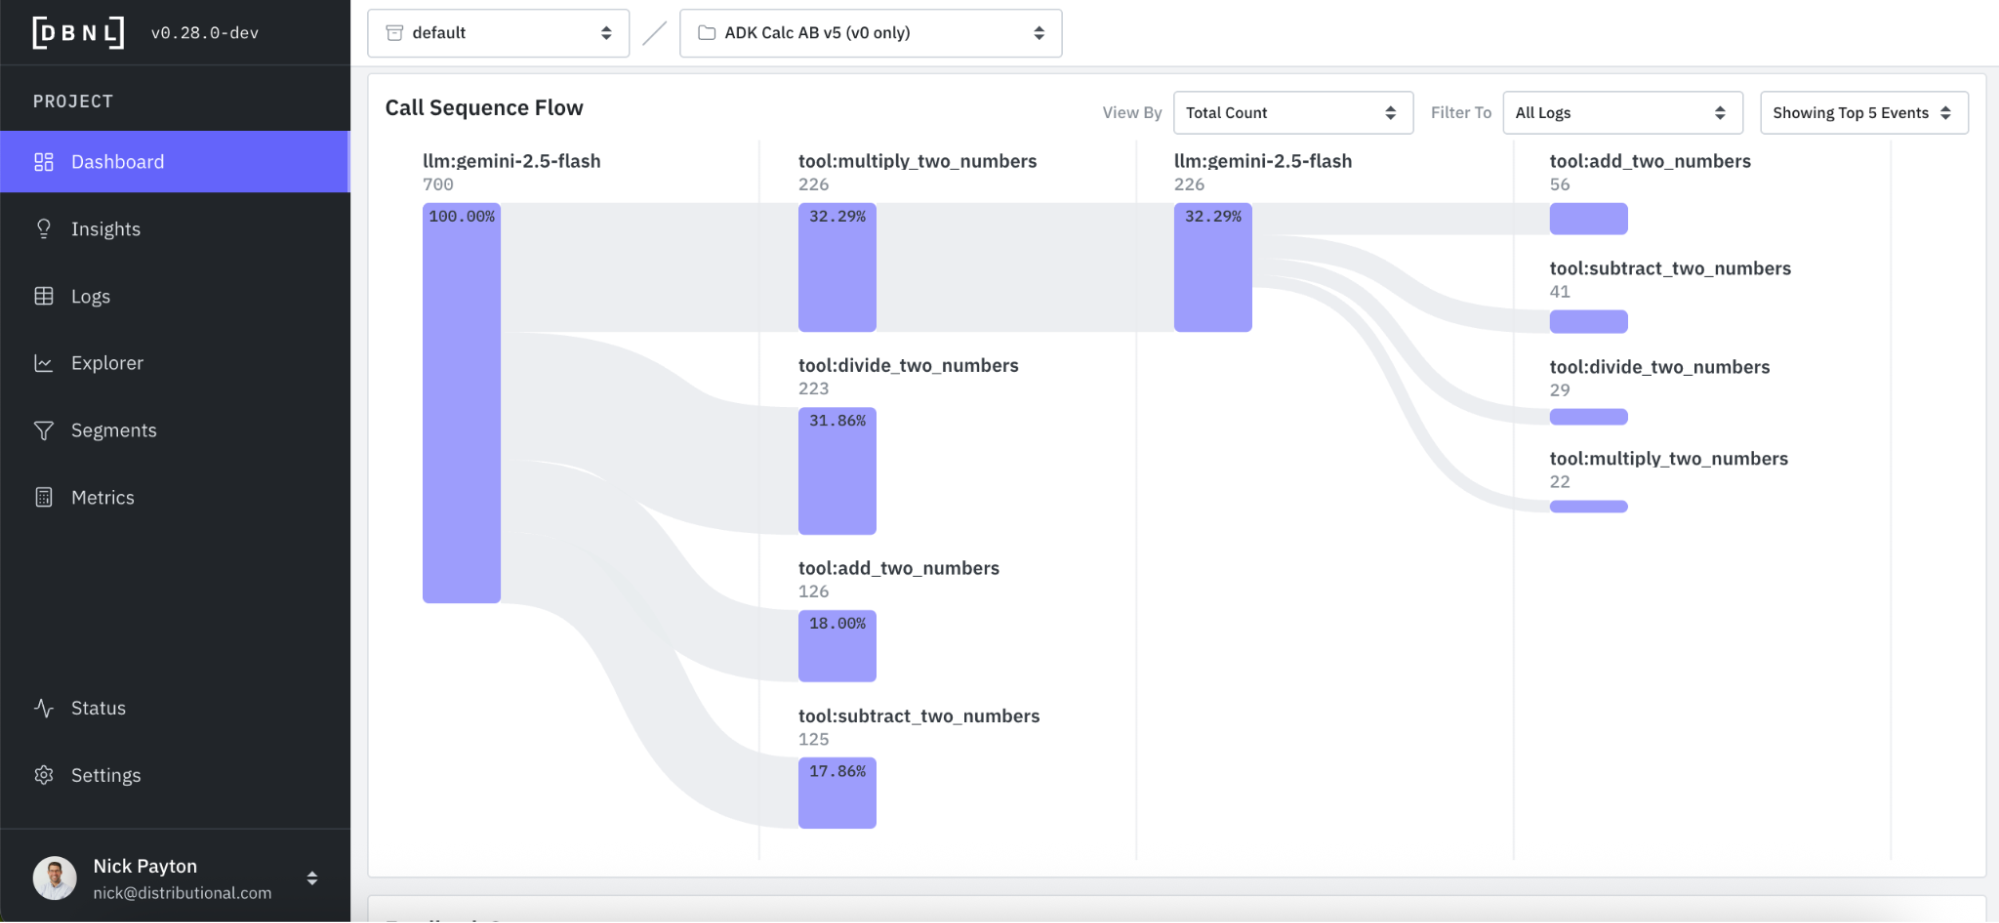
And DBNL visualizes the tool call sequence flow to provide deeper understanding of how the agent is using these tools and more intuitive debugging of issues around agent performance. This call sequence flow can also be viewed, filtered, and grouped by a variety of attributes so you can get a quick sense of whether the agent is performing as expected.
Discover an issue from a signal
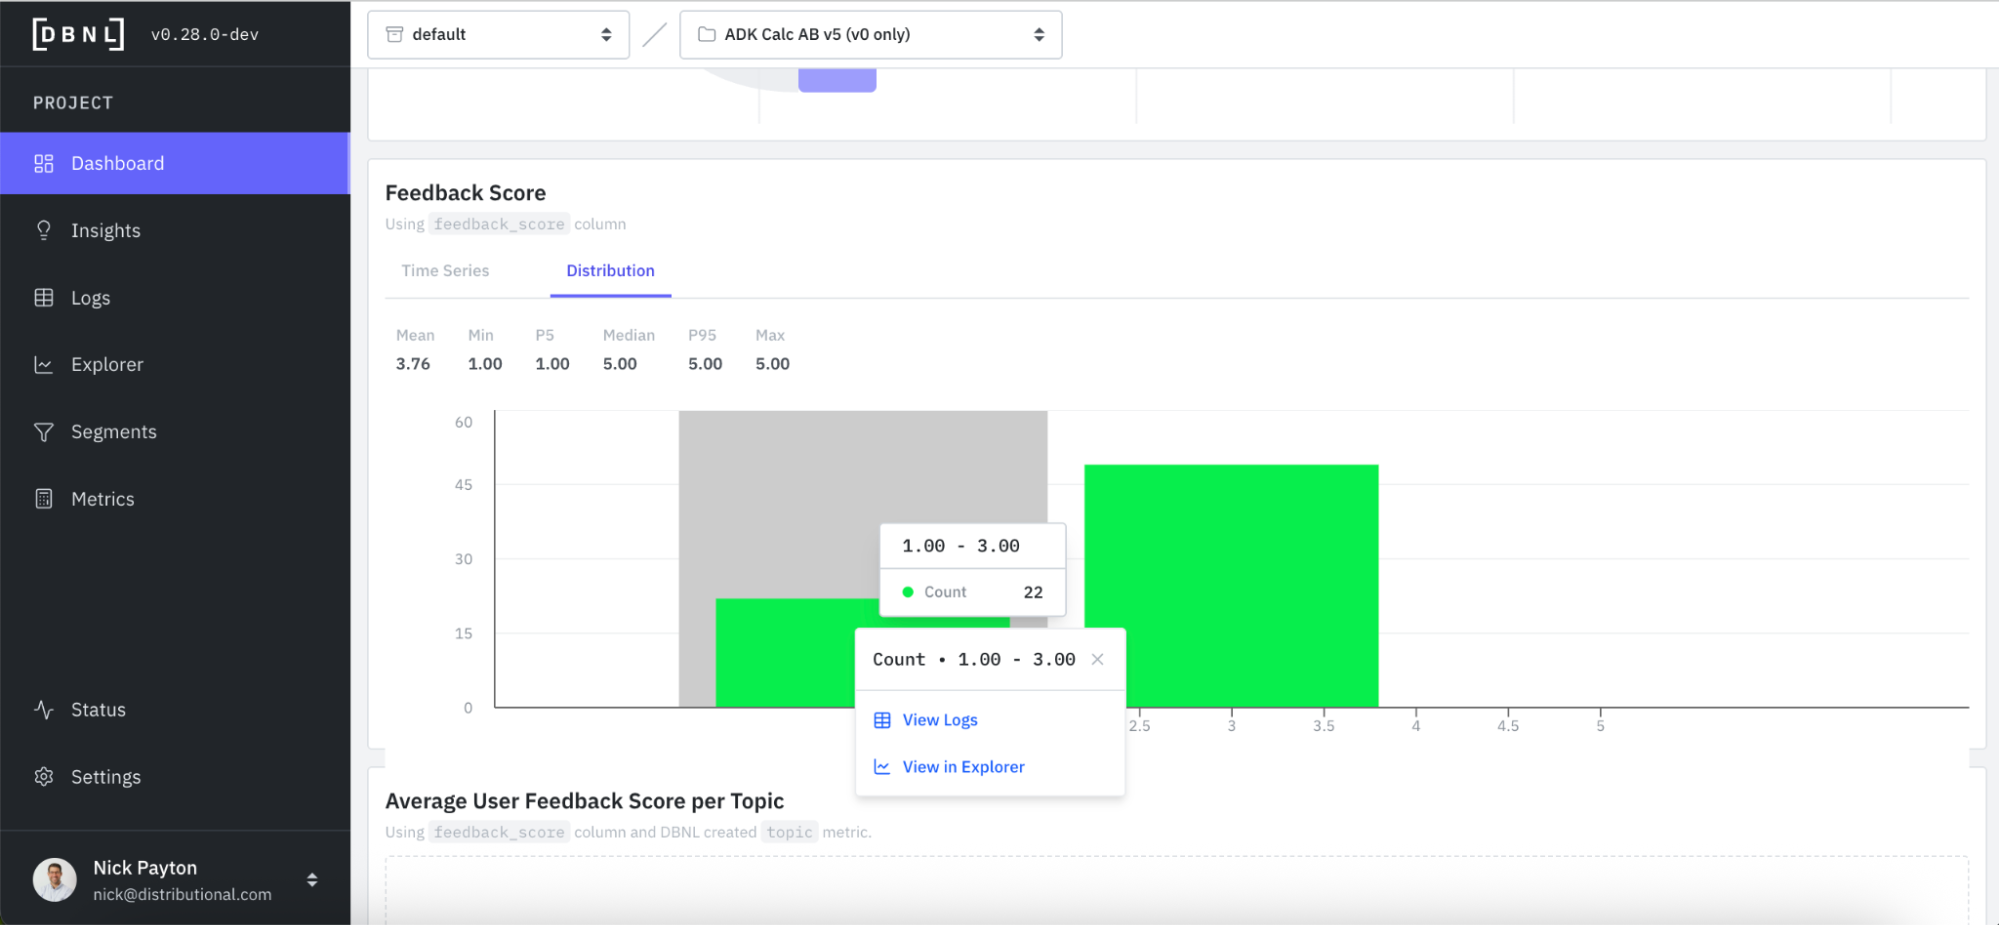
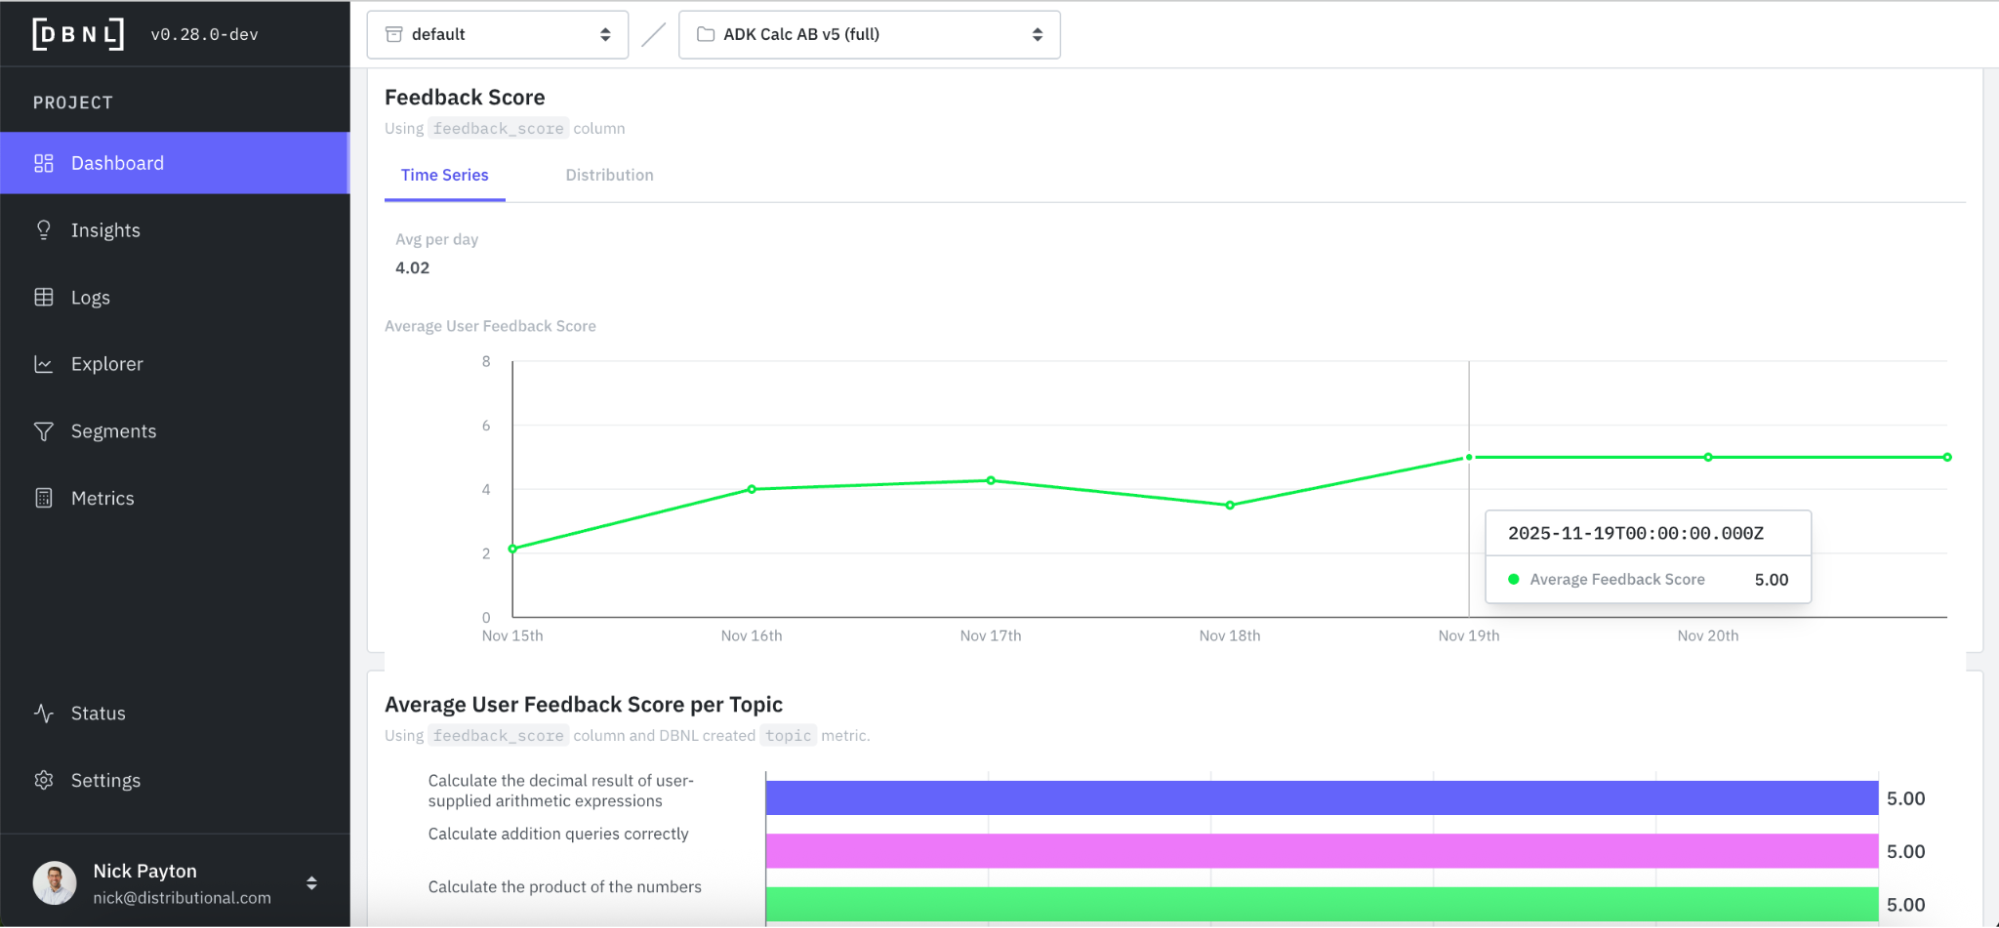
We already passively saw a signal that suggested a potential issue to investigate. Feedback scores seemed to be lower than expected, and lower than recent averages. In this same Dashboard, you can go deeper on feedback scores by looking at time series and distributions. For quick investigation, you can also directly click into logs or explorer, which we will show in the next section.
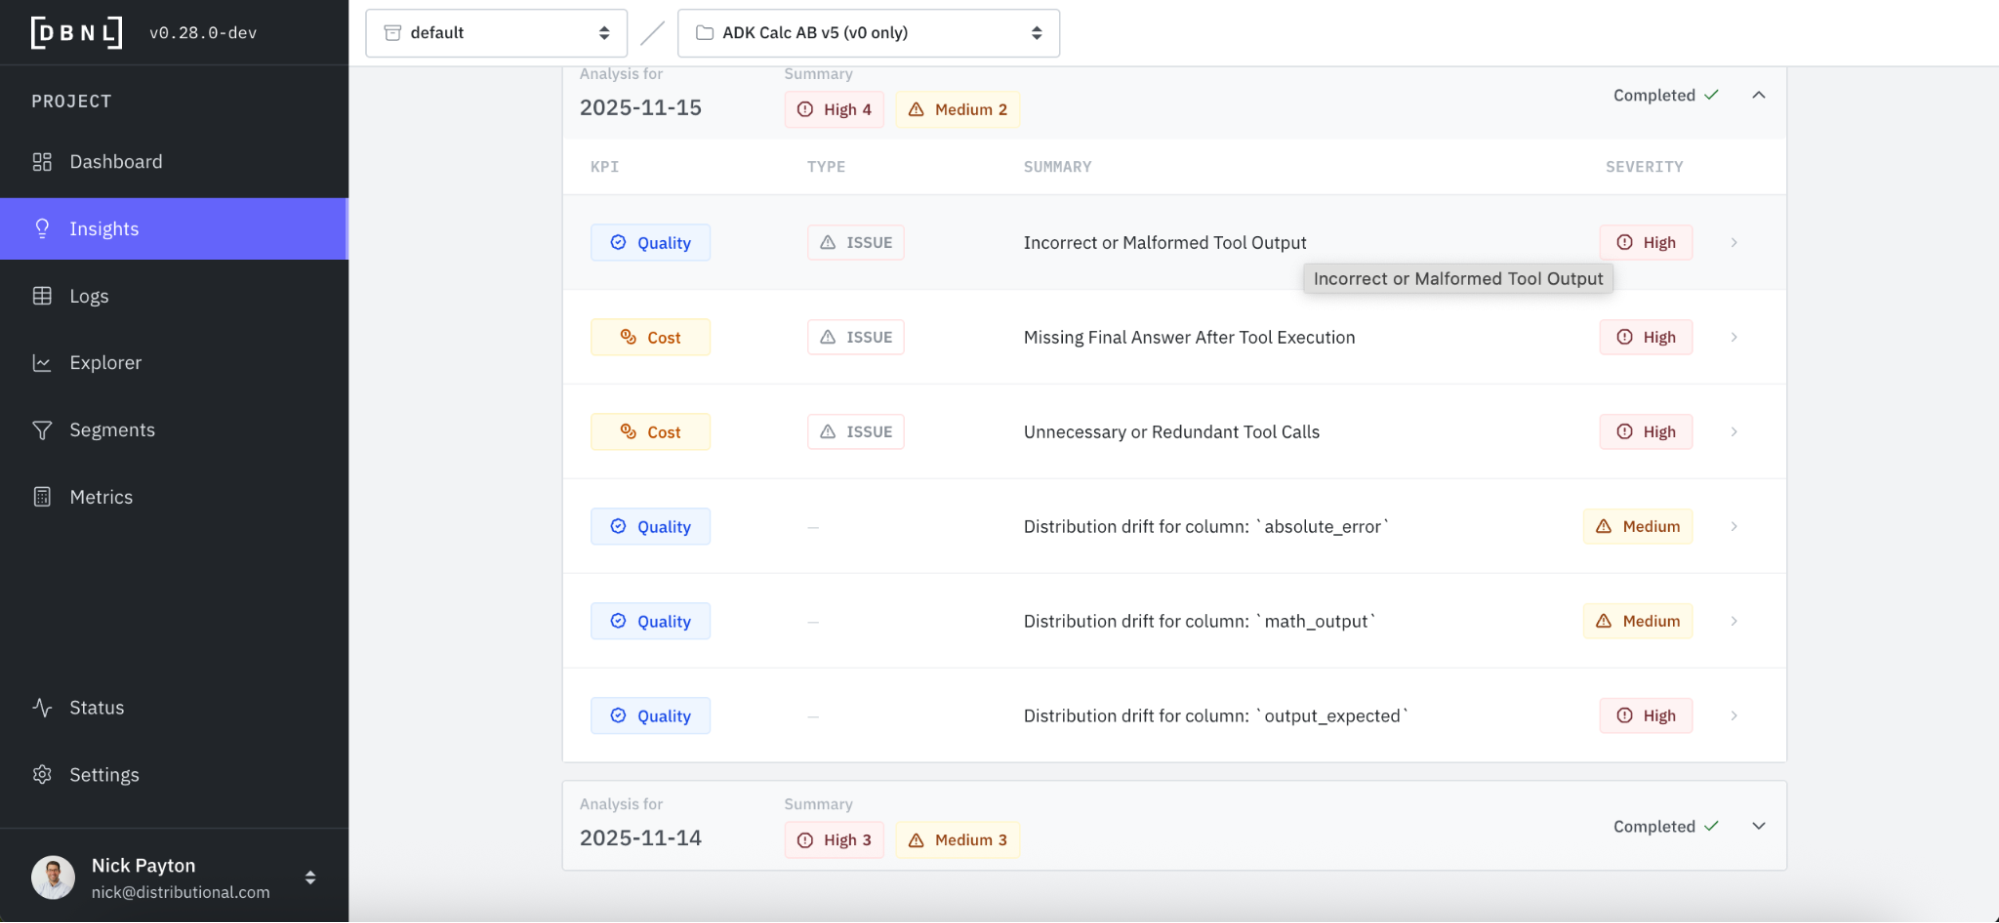
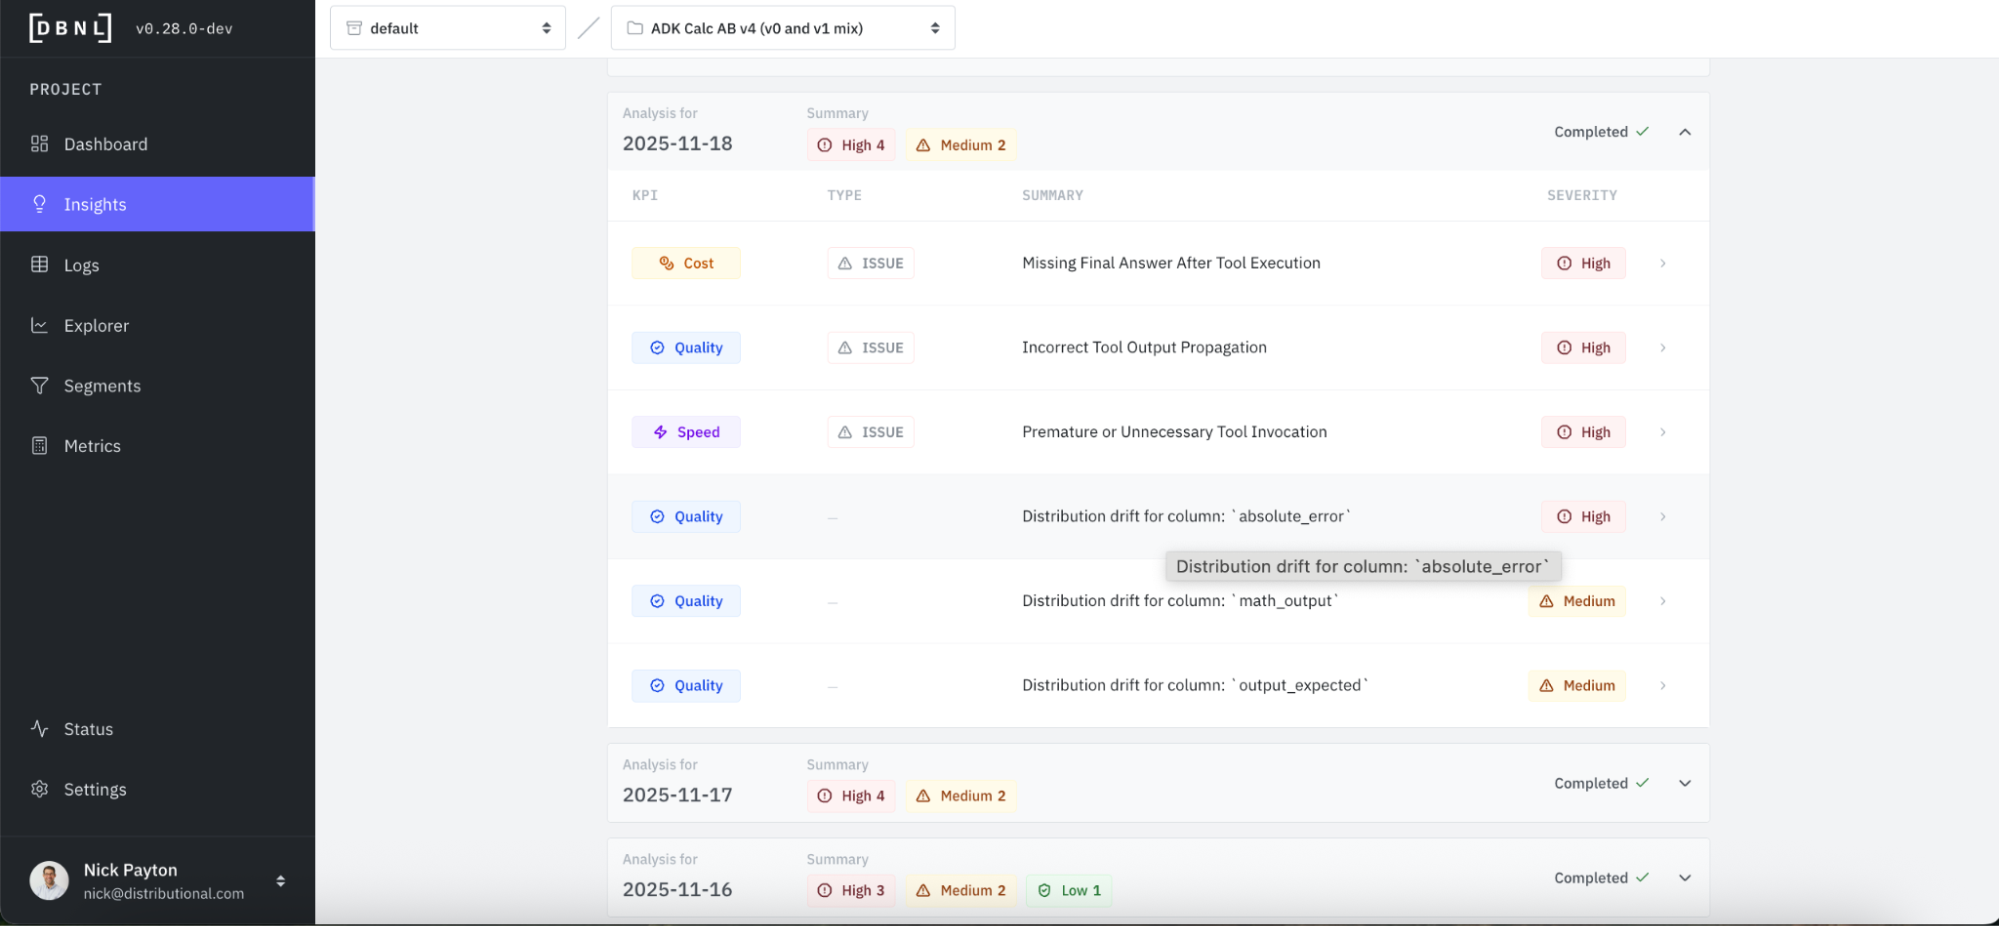
DBNL also offers a more proactive way to discover issues that also serves to more rapidly jumpstart investigation. Every day, DBNL produces Insights that are human readable summaries of signals the product found hidden in your production AI logs. These Insights can be found in your Dashboard or through Notification Connections that you configure. In this case, we immediately see the Incorrect or Malformed Tool Output issue is high severity and worth investigating, listed first in the Insights from this day.
Perform rapid root cause analysis
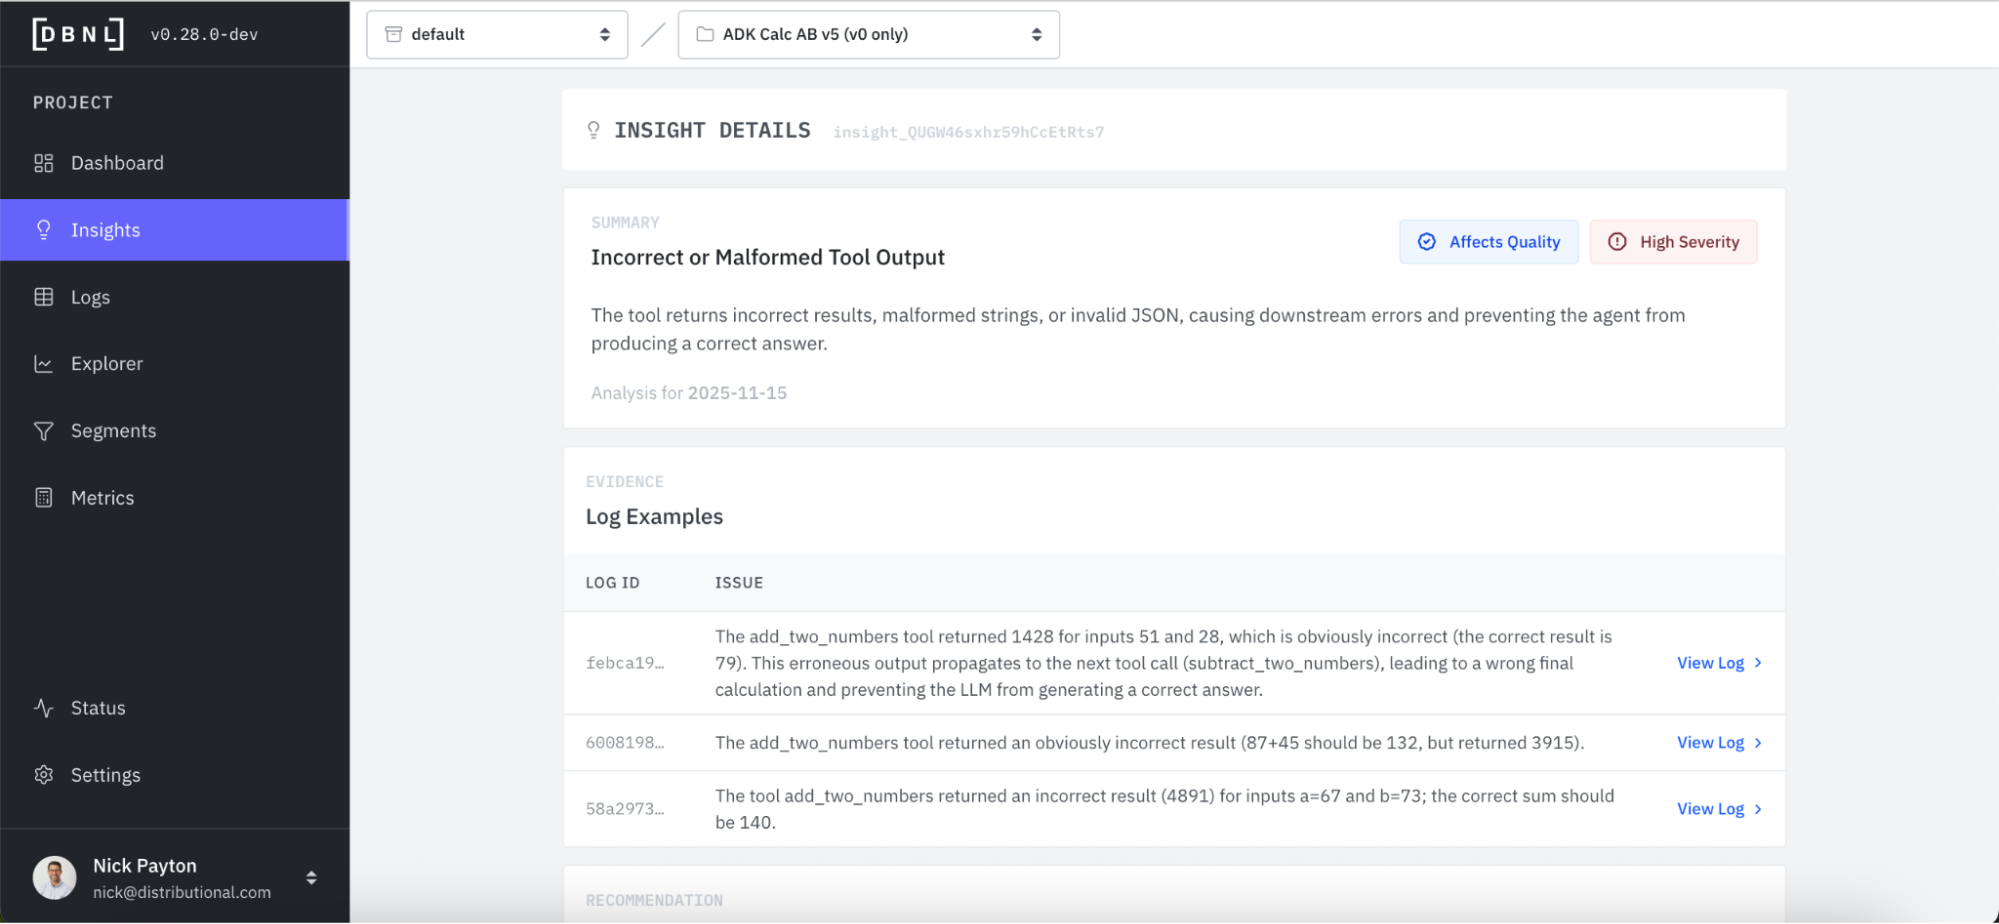
Alongside these Insights that discover issues, DBNL provides an explanation and evidence to jumpstart root cause analysis. We click into the Incorrect and Malformed Tool Output and see a simple description of the issue and a selection of relevant log examples. Immediately, we see that the issue appears to be with addition. When asked to add two numbers together, this agent is responding incorrectly.
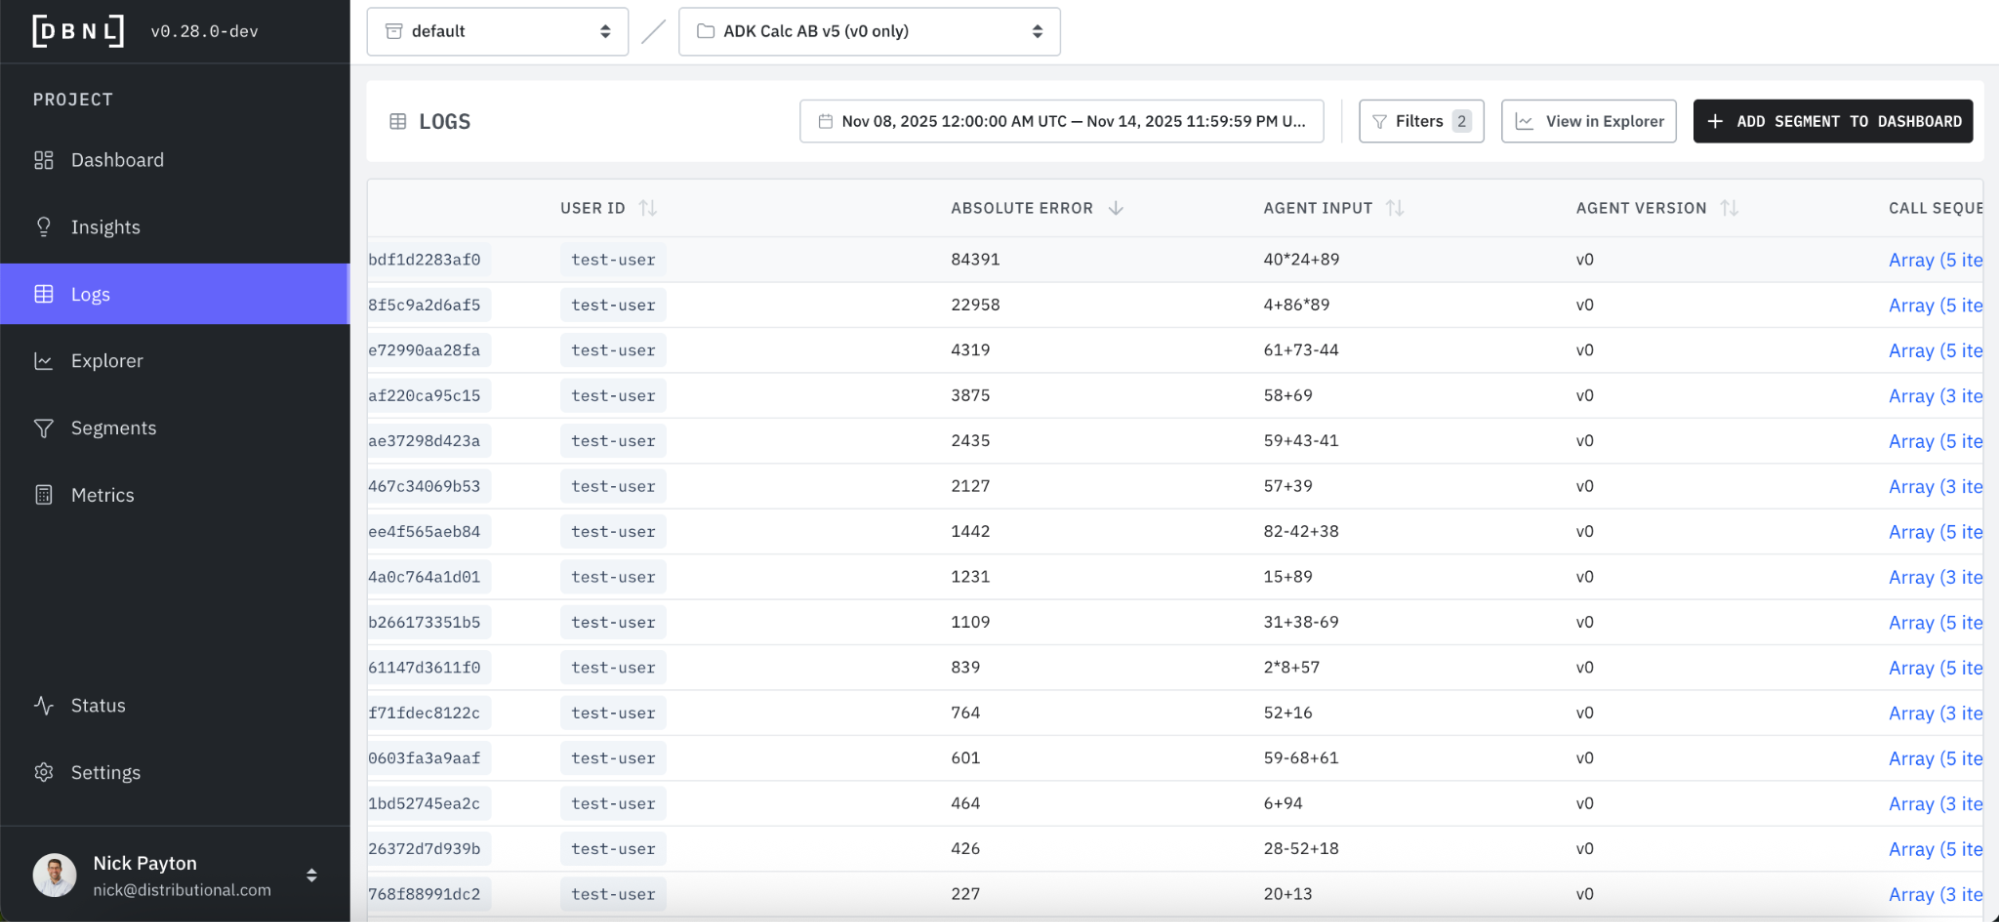
In this case, we likely wouldn’t need additional evidence, as the root cause analysis is clear. For more complex cases, however, it may help to directly investigate the logs. DBNL provides a click through to a filtered set of the most relevant Logs responsible for the issue.
You can see in these logs that the absolute error is abnormally high.
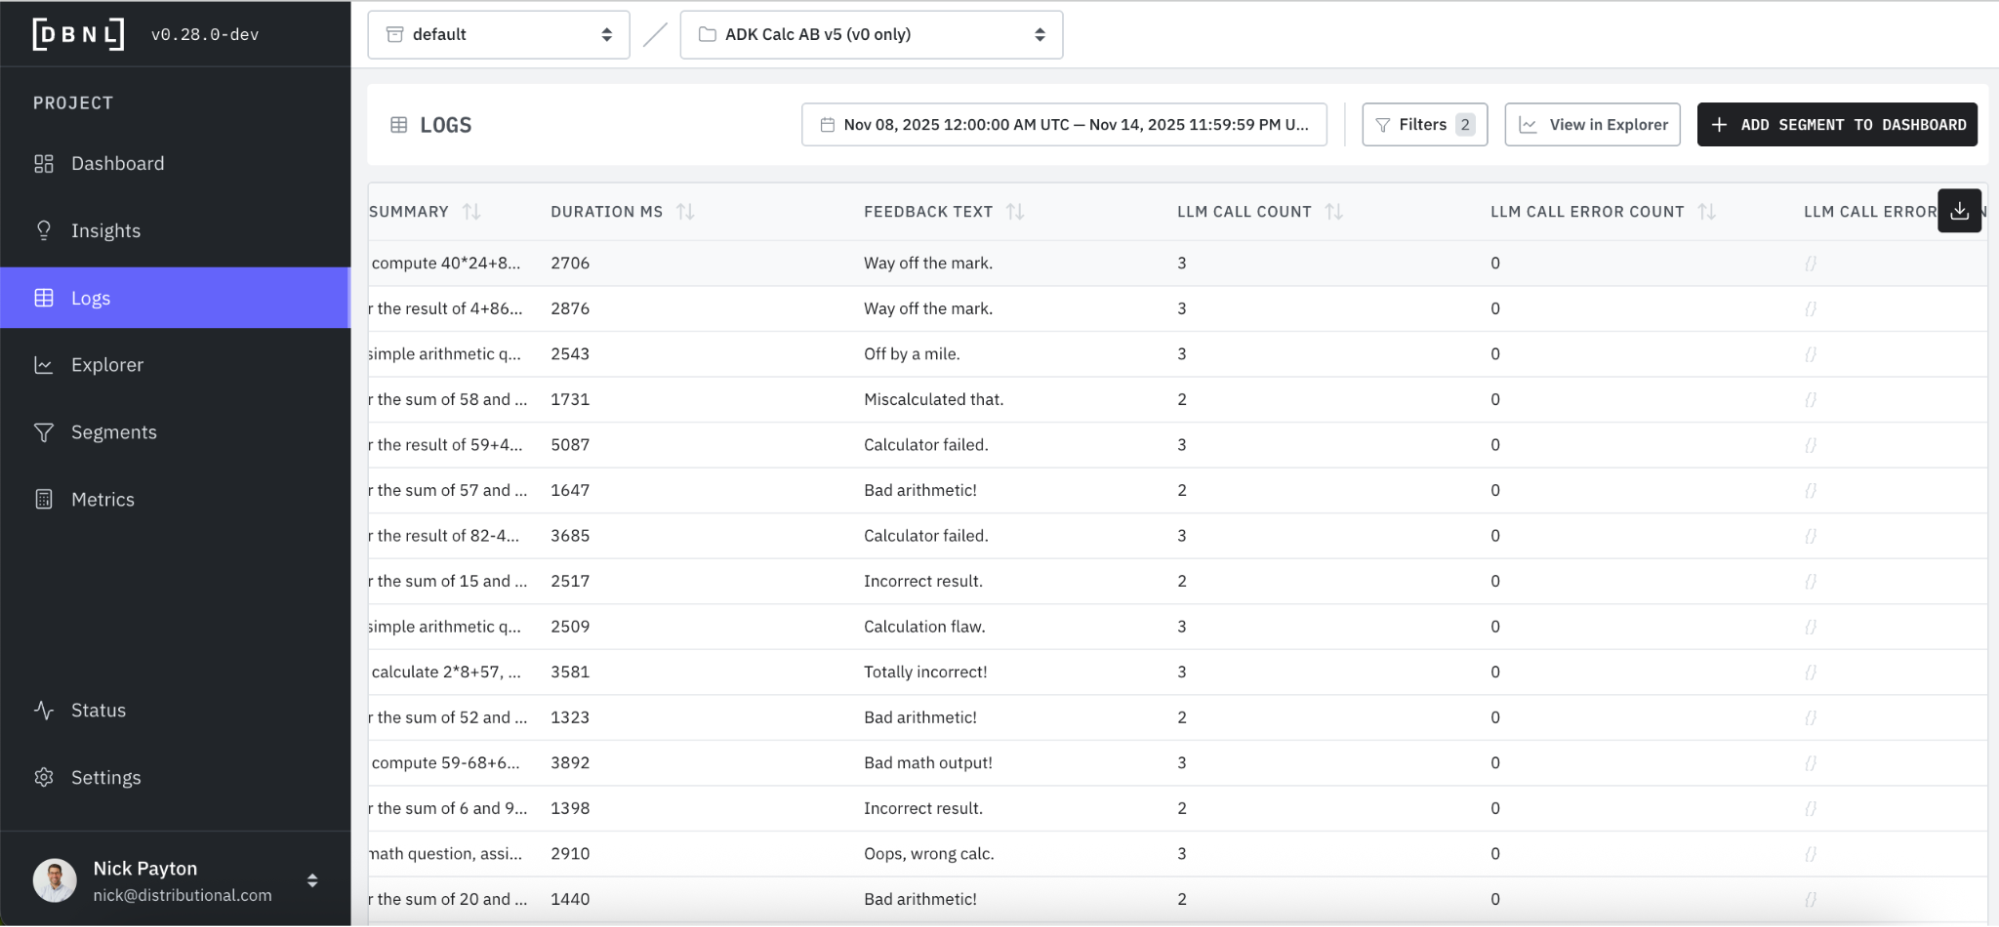
You also see that feedback is particularly negative and to the point on the low quality of the math output, confirming the issue.
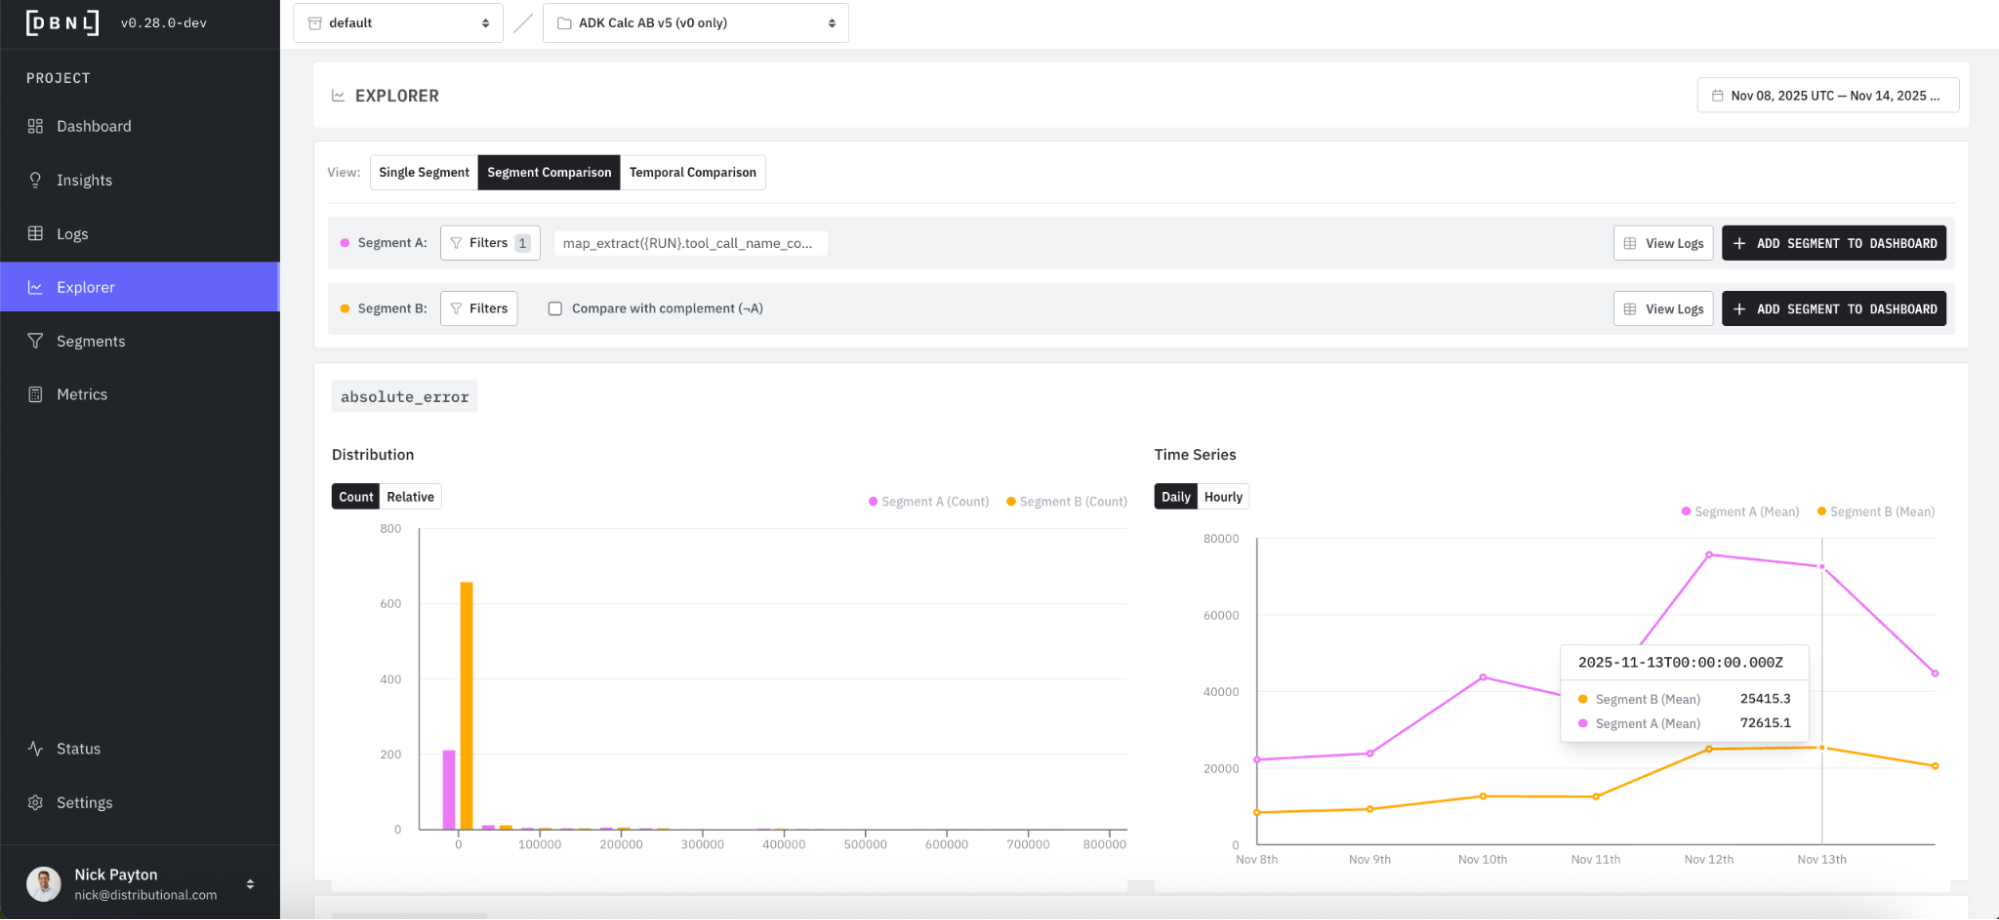
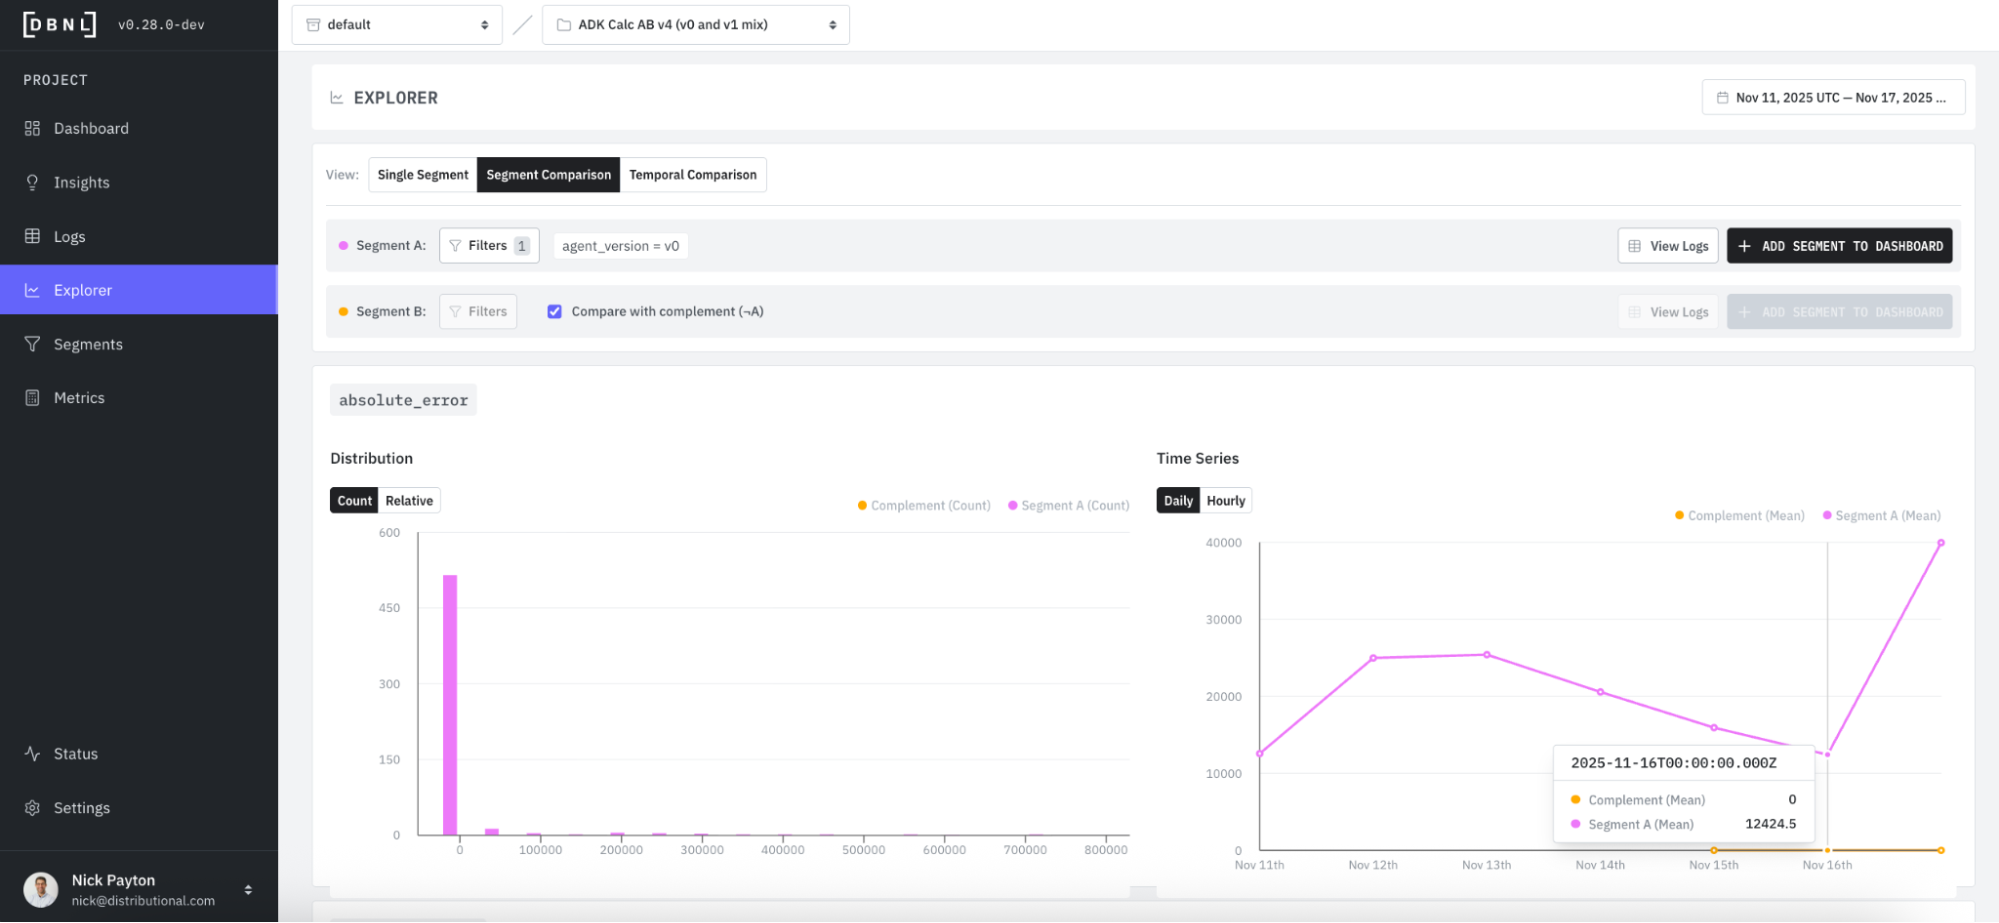
In some cases, it may also help to visualize the issue. DBNL has an Explorer that provides filterable charts and graphs to bootstrap this type of quick analysis.
When we filter by this expected issue, we get a Segment Comparison that bifurcates the data into A (where the addition tool is called, pink) and B (the entire dataset, orange) segments. Explorer shows that Segment A has much higher absolute error count than Segment B, we are more likely to see an error when addition is called than from the general population of all tool call chains.
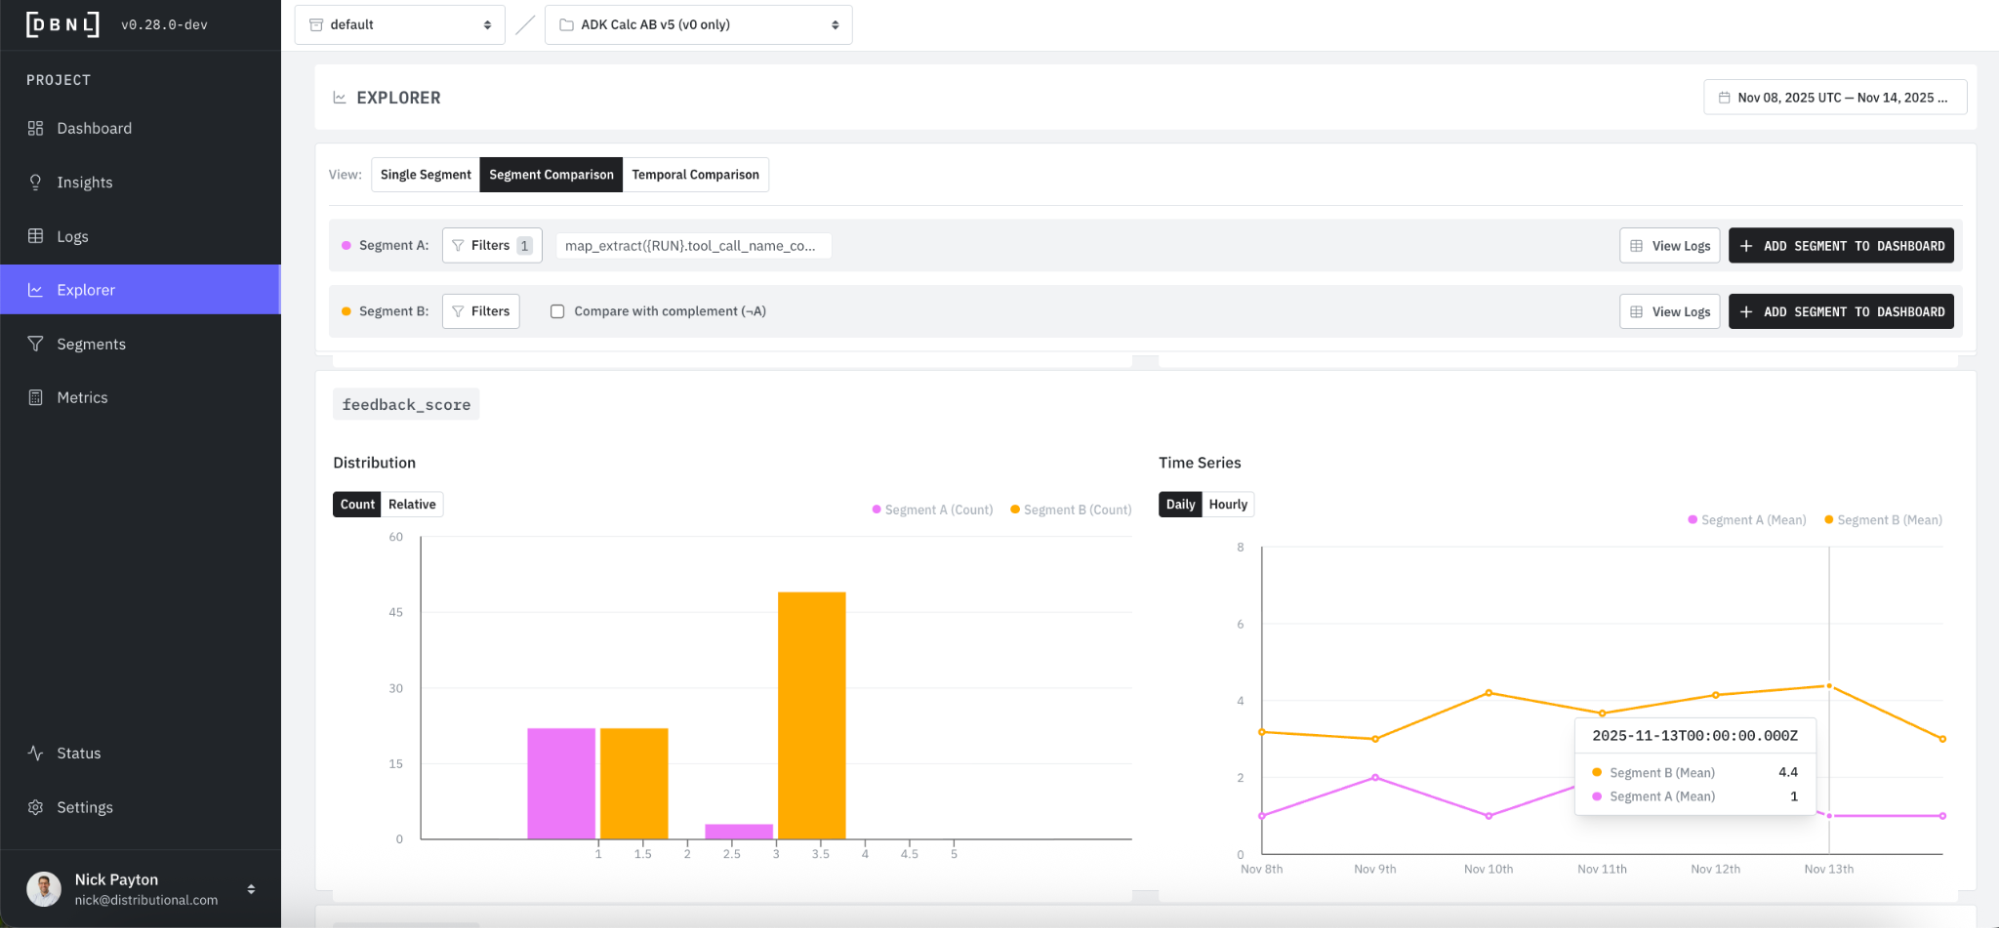
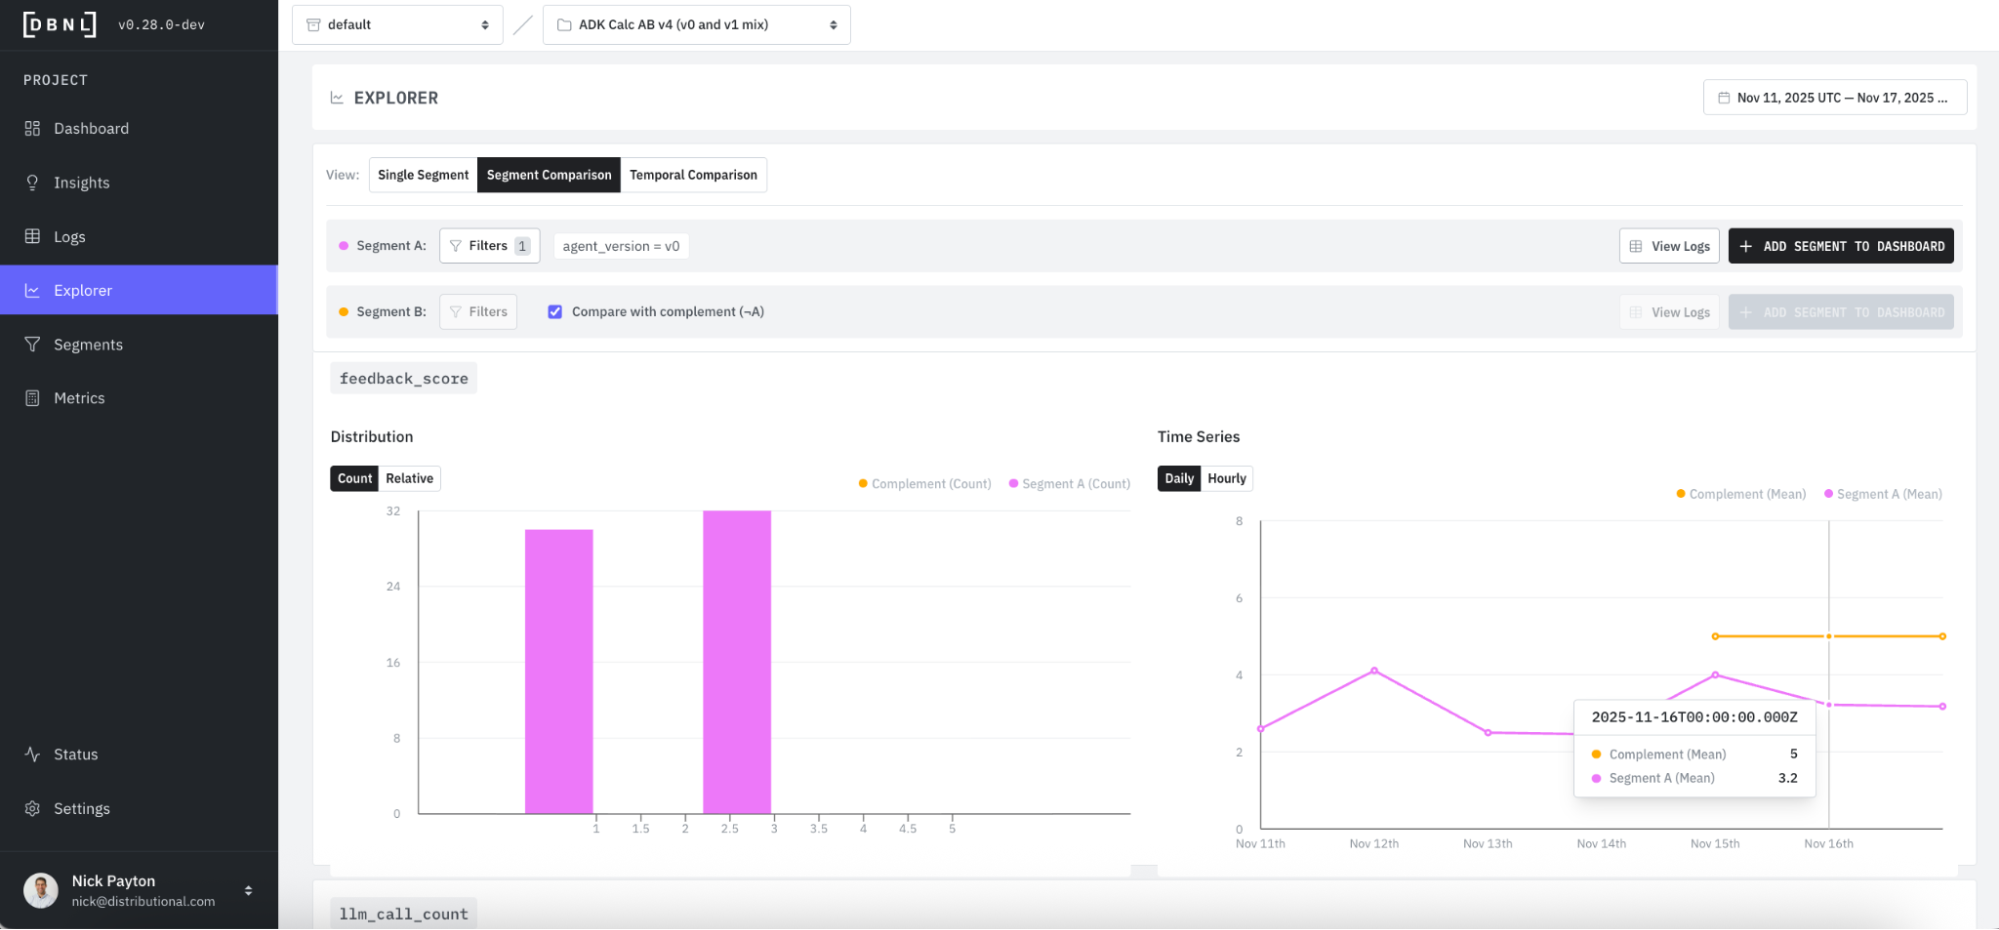
Progressing further down the Explorer page, you see Segment A has a much lower average feedback score than Segment B.
Fix the issue
DBNL provides suggestions to fix an issue. Fixes happen off of the DBNL platform alongside the root cause analysis that assists in guiding the fix.
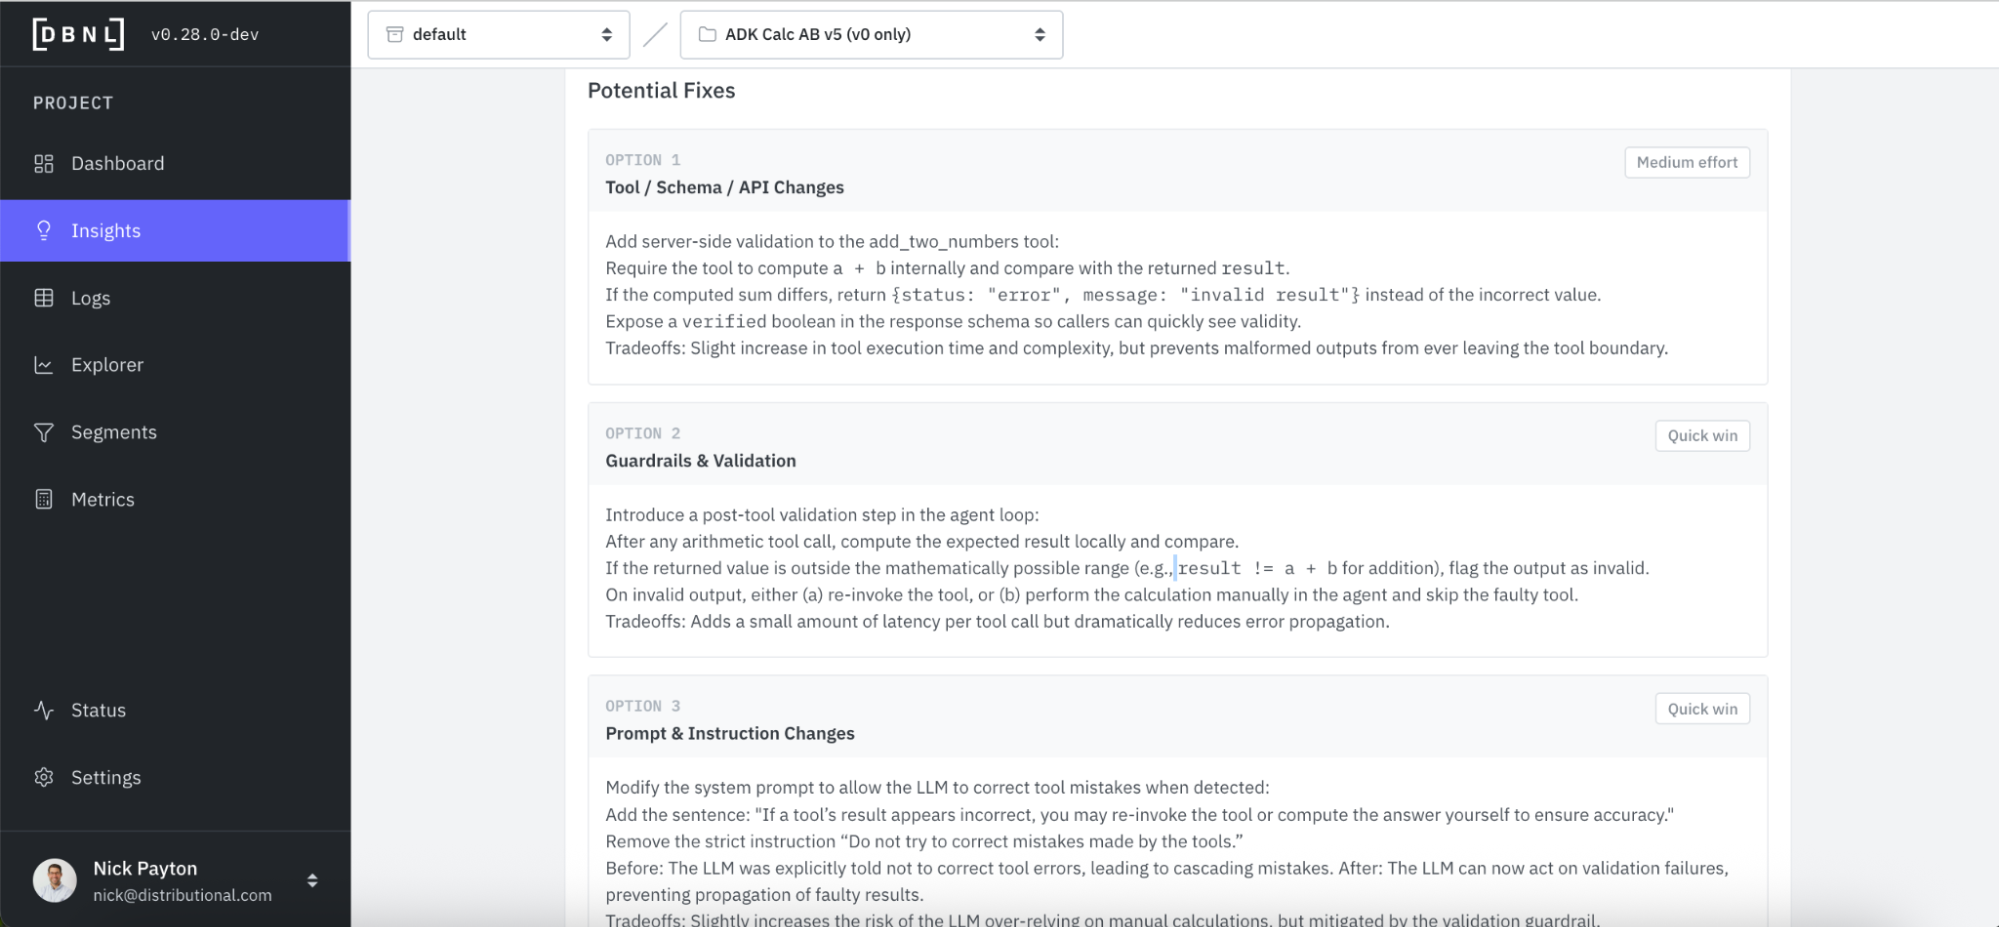
Directly attached to the insight, DBNL proposes a set of potential fixes. In this case, DBNL recommends a tool change, guardrail, or prompt adjustment, with different tradeoffs and an estimated effort to apply the change.
We take DBNL’s advice, and start by checking the tool. Immediately, we see an error where our addition tool multiplies two numbers instead of adding them.
def add_two_numbers(a: float, b: float) -> dict:
"""Returns the sum of two numbers by adding them together"""
# We intentionally introduce a bug where it gives the wrong answer because we accidentally typed `*` instead of `+`
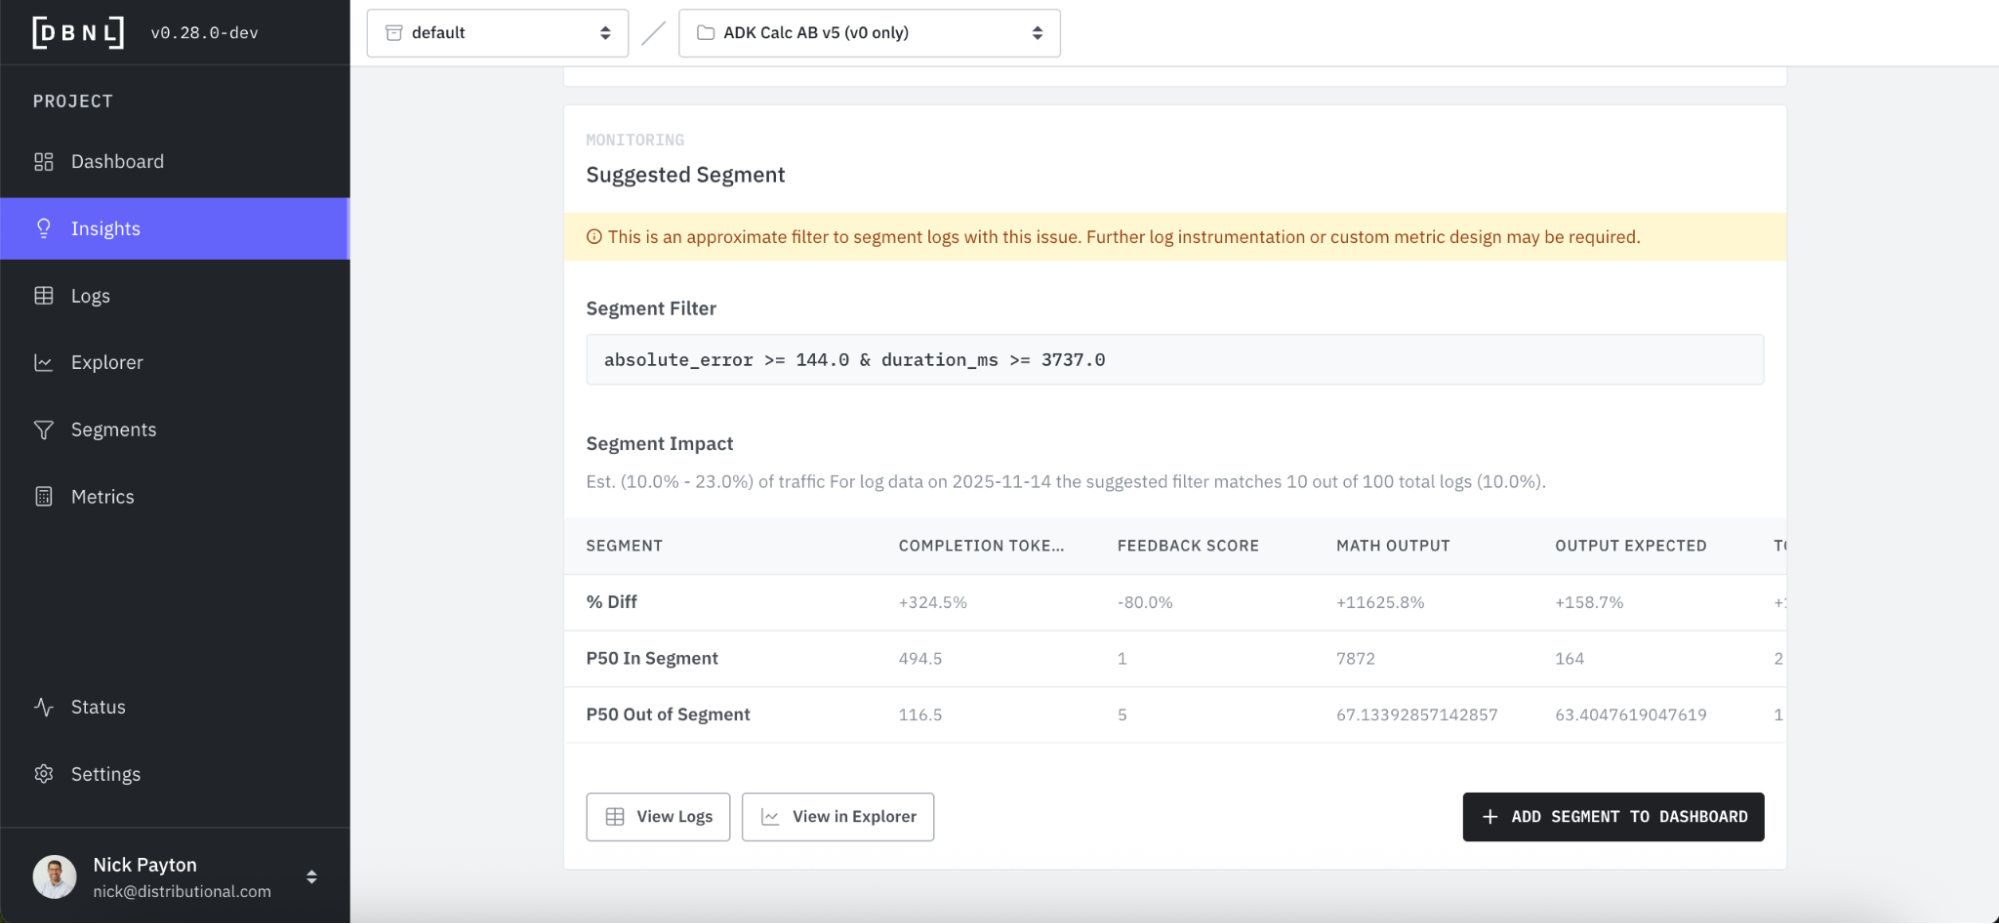
return {"status": "ok", "result": a * b}Alongside DBNL’s recommendations for fixes, DBNL also suggests segments you can track so that you can keep tabs on an issue you want to triage later, ensure a fix actually addresses an issue, and ensure that resolved issues don’t reemerge. By adding a new Segment, DBNL will add this to the Segments Dashboard and provide Insights on it going forward.
A/B test the fix
When deploying a fix, AI product teams often want to A/B test the solution. DBNL offers a convenient way to analyze this A/B test to confirm the fix. In this example we will roll out a fix as a 50/50 A/B test.
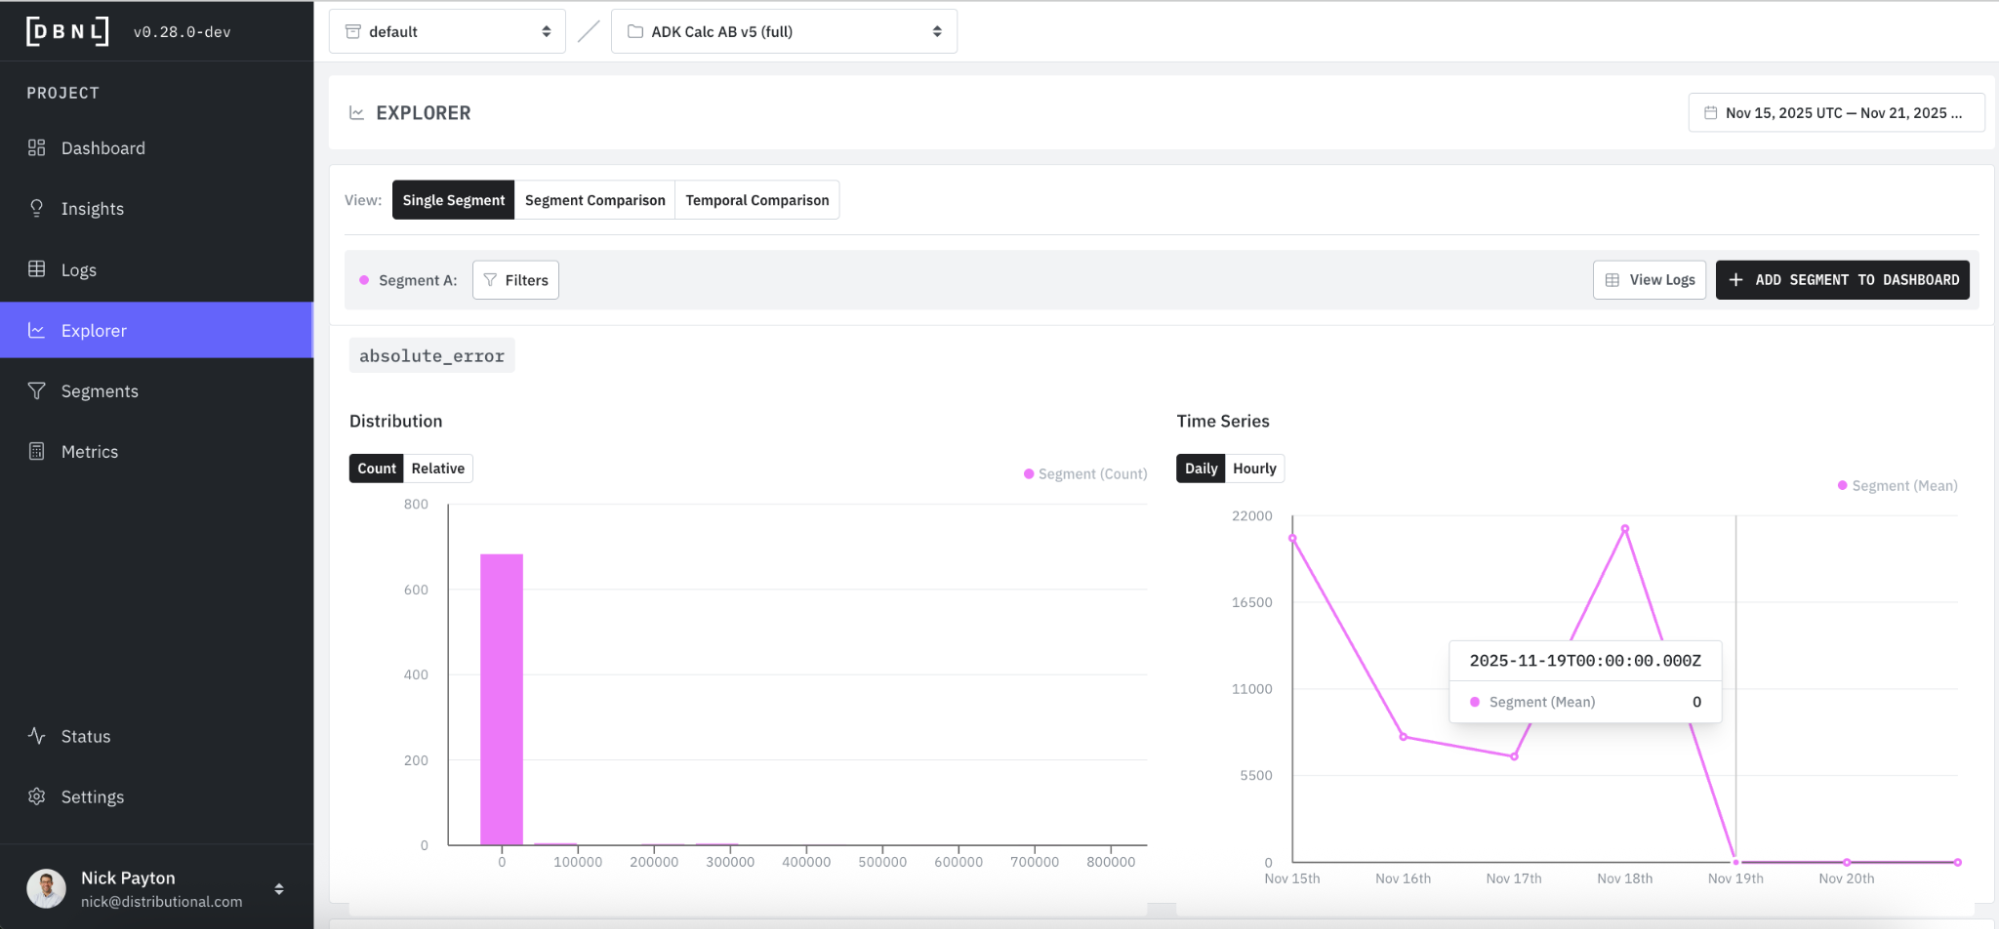
For this calculator, we are able to extract the cohort each trace belongs to by tracking the product version as an attribute. When we made the fix, we created two versions of the agent, v0 to v1, and we can now filter on this attribute in Explorer and compare Segment A (pink, v0) to Segment B (orange, v1).
We’d expect to see a reduction in absolute error for v1 (orange), and we see this confirmed – error is now zero for v1.
Conversely, we’d expect to see average feedback score jump for v1 (orange) compared to v0 (pink). For v1 (orange), we see that feedback is universally positive, with an average score of 5.
We even see this fix showing up in Insights, where a positive distribution drift was detected.
Track the fix
Regardless of whether you A/B test the fix or not, you will want to track it to confirm the change is working as expected and the issue has been resolved. You can do this in DBNL.
First, we see that DBNL passively tracks this and reflects the change in the KPI at the top of the Dashboard. Average feedback score has jumped back up.
You can also see this reflected in the feedback score time series, with all recent days showing 5 out of 5 for user feedback.
Jumping back to Explorer, we can track these changes in metrics as well. We see absolute error dropping to zero in this chart as one example.
Improve AI with signals from production logs
In this example, we show you how to use DBNL to discover, investigate, a/b test, and track a fix to an AI calculator agent in production. This calculator agent is a simplified example, but all of the same features in DBNL can be used for even the most complex AI agents receiving millions of requests per day.
The key to this workflow starts with finding signals for what to fix or improve from the AI production logs themselves. When DBNL—rather than bespoke data analysis—does this automatically, it ensures you don’t miss a signal you didn’t know to look or eval for, which could end up being a big issue. If we didn’t catch the basic addition error, nobody would end up using this calculator over time. Similarly, grounding this analysis with direct evidence from logs makes it much easier to run A/B tests and confirm the change after it is made. And instantiating this full workflow in DBNL gives the entire team a central source of information on what is and isn’t working with their complex AI products.
All of this is useful for this calculator example, but becomes even more critical as the complexity of the AI agent increases or scale of usage grows. Run this example to get familiar with DBNL or install the full DBNL service for free in your environment to get started on your own agent.
Subscribe to DBNL
Thank you for your submission!
Oops! Something went wrong while submitting the form.