In a recent conversation with an innovation leader at one of the largest asset managers, he put his problem quite simply, “How can I get my team to move from passive monitoring to active governance of their agents in production?” His view was that analytics on production traces could complement their existing reactive monitoring stack to give them a more proactive way to probe and assess what needed to be fixed, could be improved, or was even happening with their agent in the first place.
His experience inspired our demo with a much more streamlined financial research agent. In this example, we’ll show you how to use Distributional’s (DBNL’s) unsupervised, automated analytics on production agent traces to drive more active governance of an agent in production.
To explore this data using our read only SaaS demo environment, go to https://app.dbnl.com, use these credentials, and select the project “Financial Research Agent Example”:
- Username:
demo-user@distributional.com - Password:
dbnldemo1!
And to test the product yourself, you can install our sandbox to get started.
Setup
We built a relatively streamlined financial research agent that uses gpt-4o-mini to call a variety of tools (stock symbol, stock price, stock news, company info) to answer questions related to a company’s financial performance. We simulated a few hundred queries per day to provide a reasonable distribution. I grabbed the first session in the logs that Distributional analyzed to provide a sense of these queries.
Understanding baseline behavior of this agent
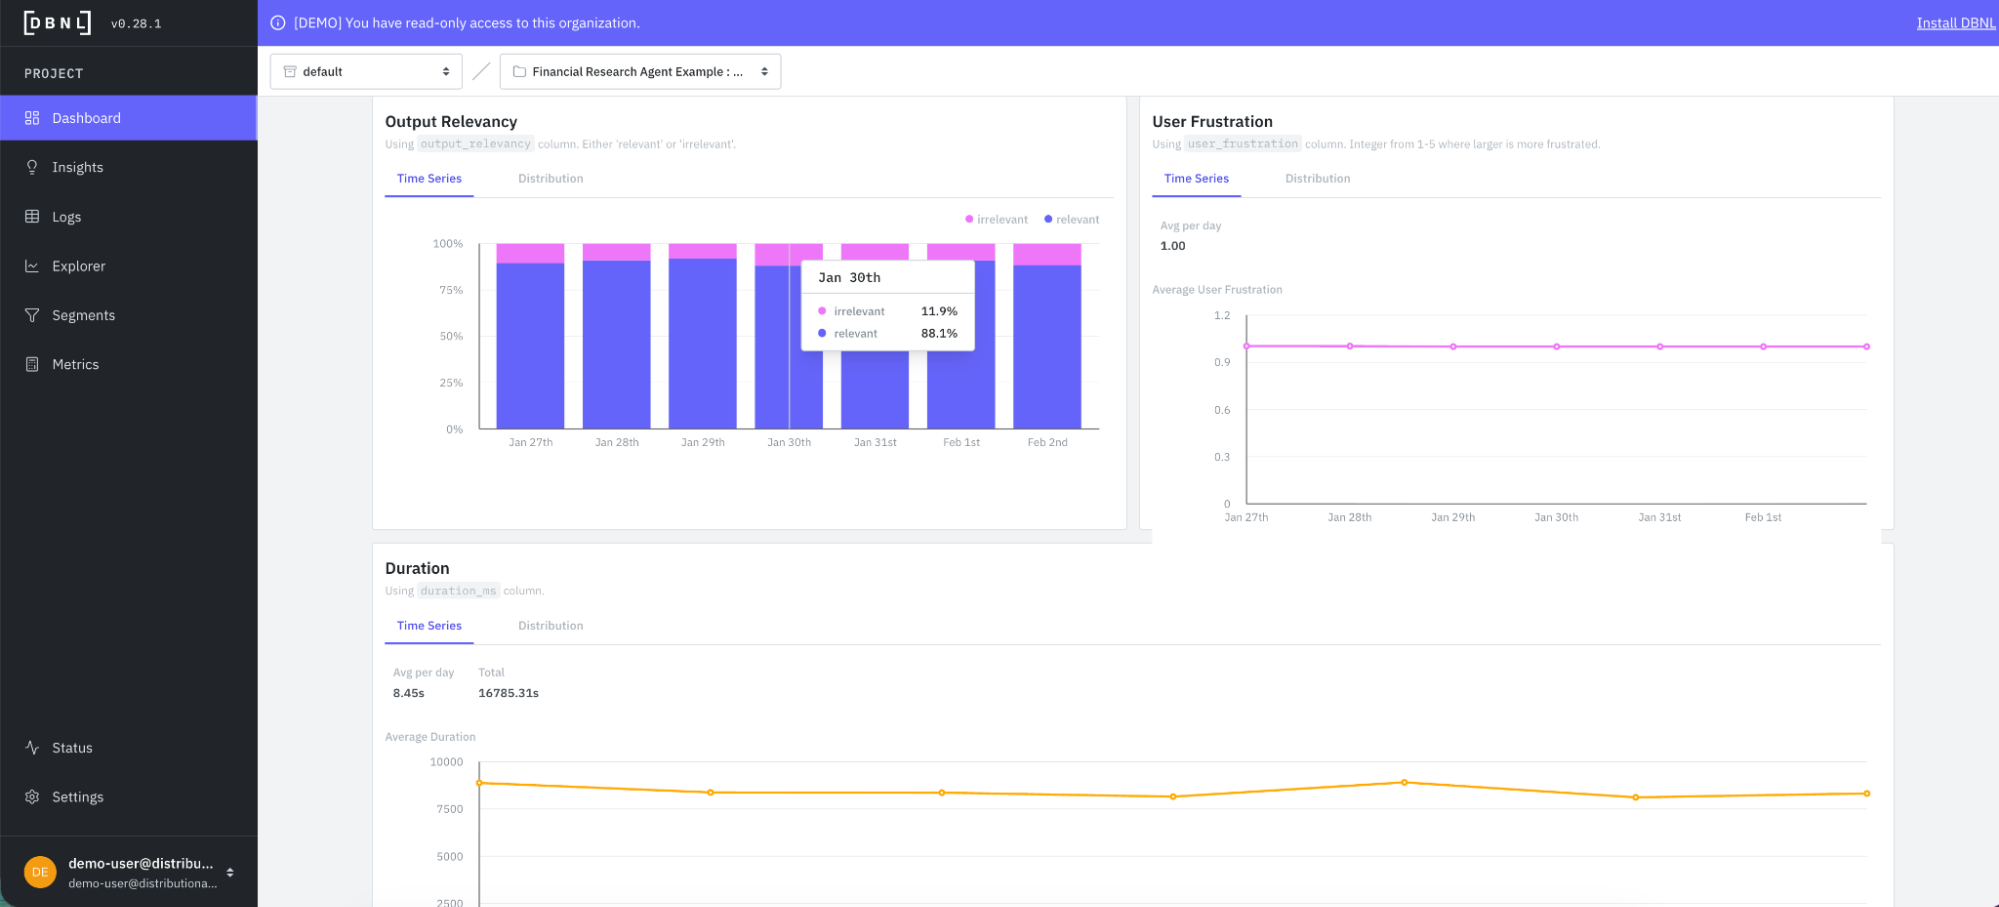
Out of the box, Distributional provides a variety of useful information to help understand agent behavior in the context of usage patterns. Distributional summarizes standard cost, speed, and quality metrics that you’d see in any passive monitoring system to ground other analytics in this context. But DBNL builds on this foundation in a few ways.
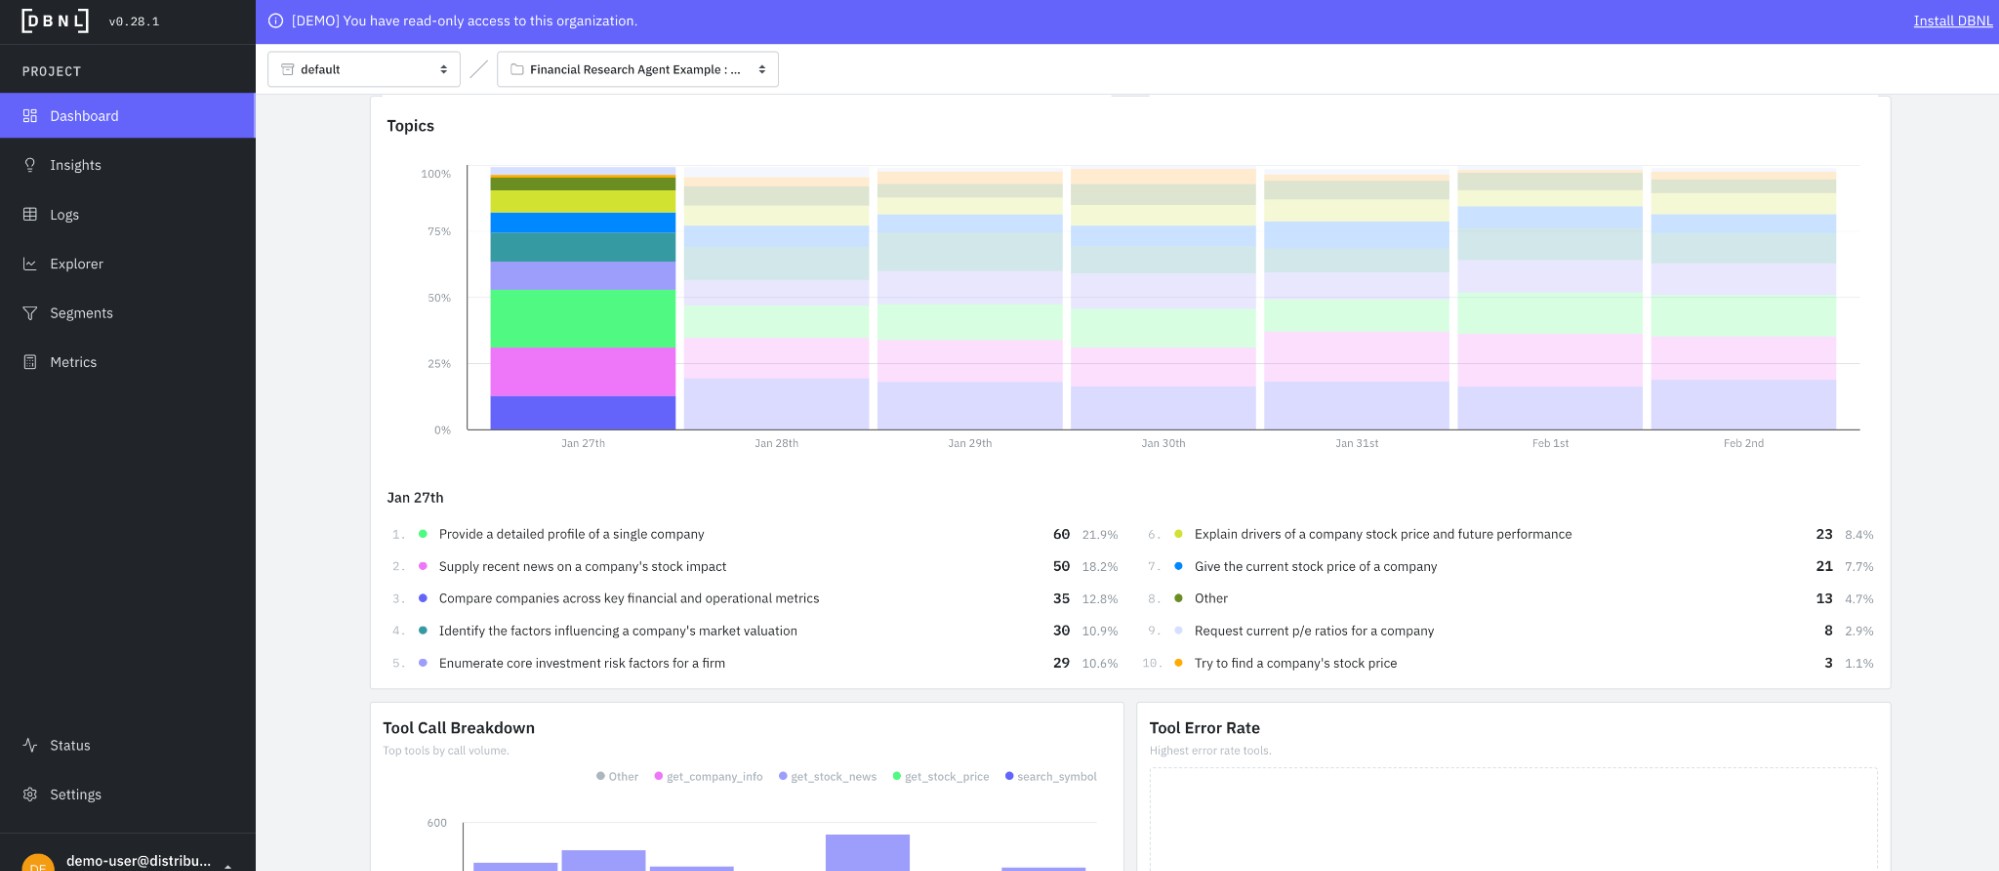
After seven days of data, DBNL produces topics and classifies requests into these topic categories. These topics represent user intent, and DBNL shows how the propensity of these topics shift over time. In this case, most users are asking for detailed profiles of a single company, recent news that impacted a company’s stock, or comparisons for multiple companies across financial and operational metrics.
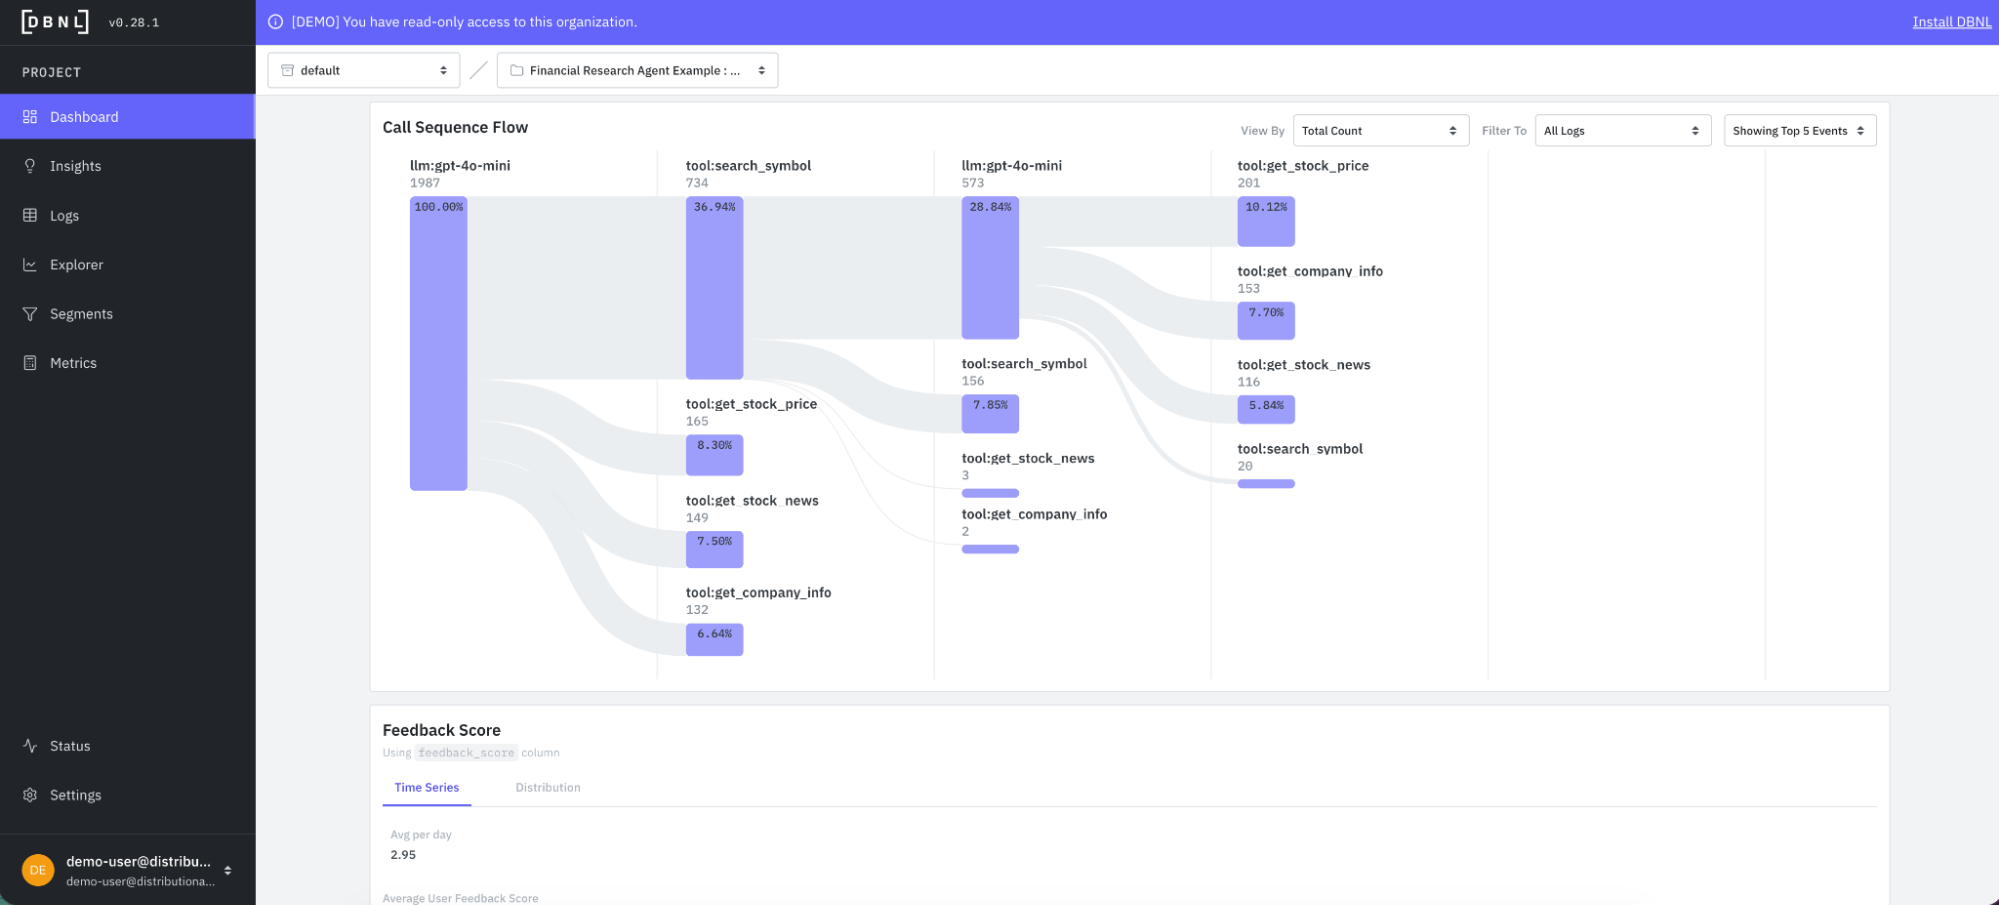
Along with topics, DBNL also automatically produces a tool call sequence flow. This flow gives a summary of how the agent is calling tools, and can be filtered by interesting segments of logs.
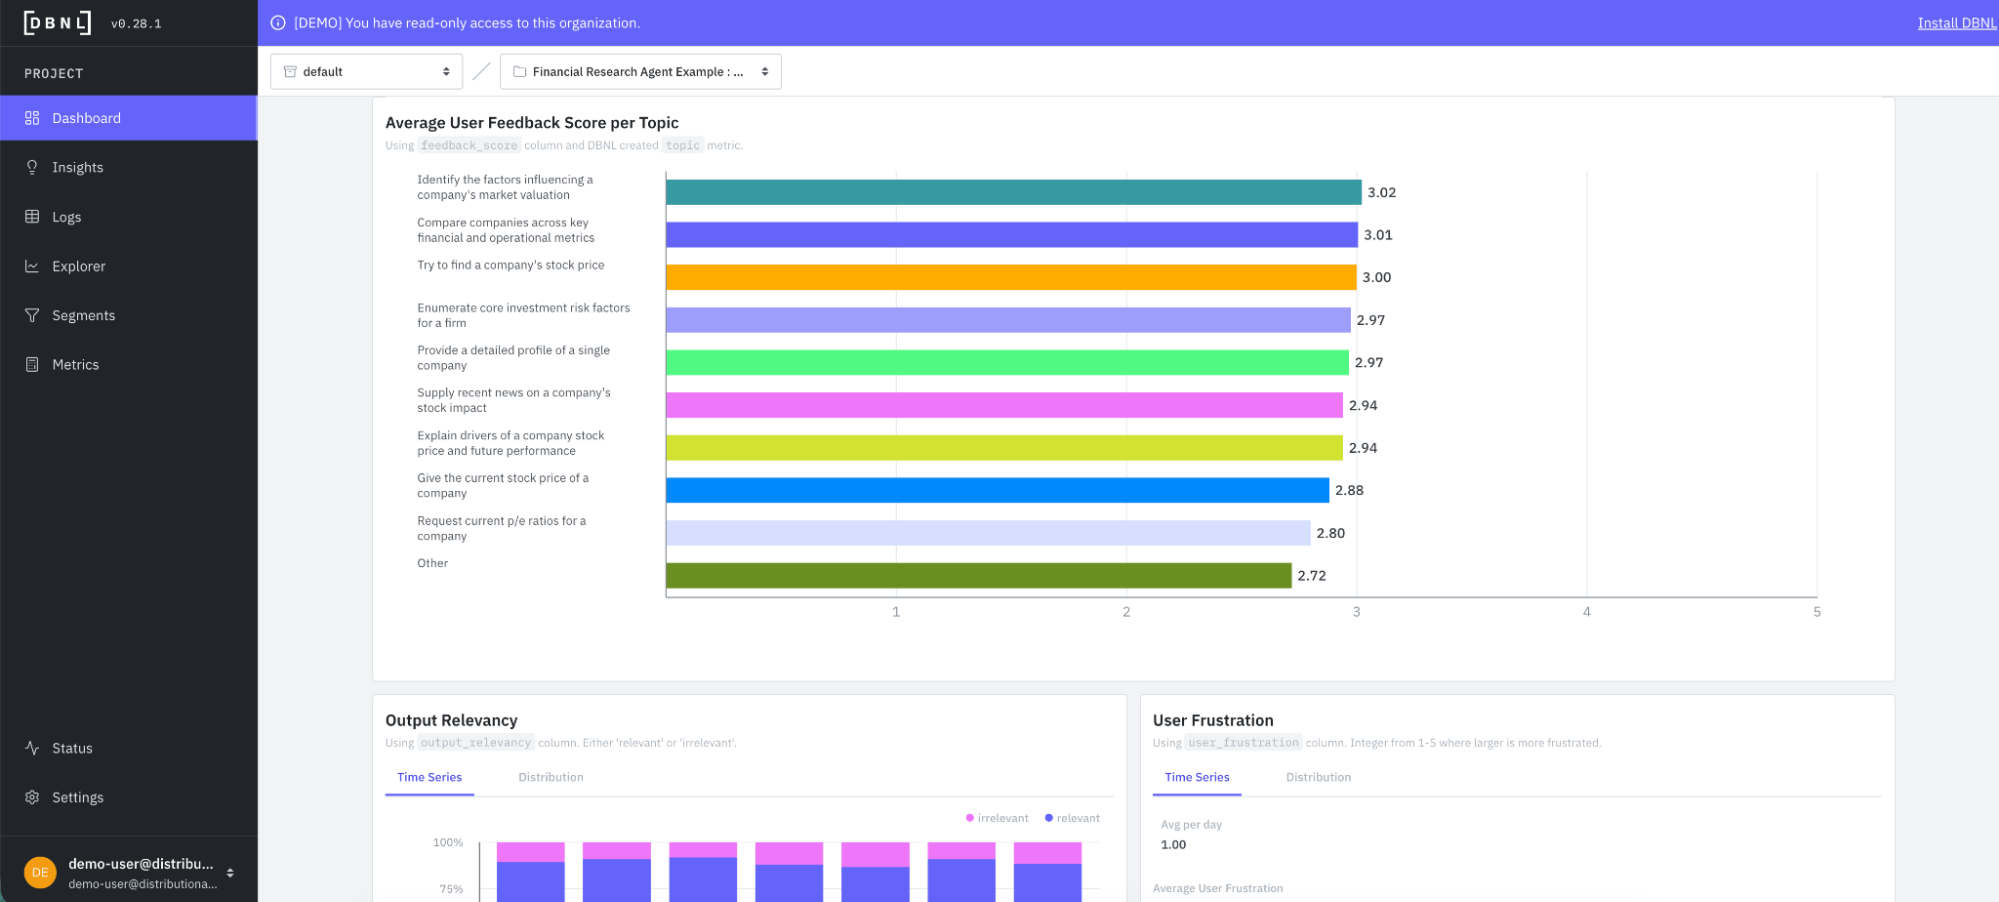
DBNL also grounds topics, which offer insight on inputs, in the context of downstream metrics and KPIs that offer insight on outputs. This provides a quick sense of whether there is a potential issue with a given type of query. In this case, DBNL assesses average feedback score by topic to provide this view of input-output consistency.
Distributional also produces a variety of standard LLM-as-judge metrics out of the box that track response quality across all production agent traces. DBNL sets you up to use your own model for these metrics, but also includes recommendations in the docs for models that work particularly well and efficiently for these analytics.
Proactive insights on agent behavior
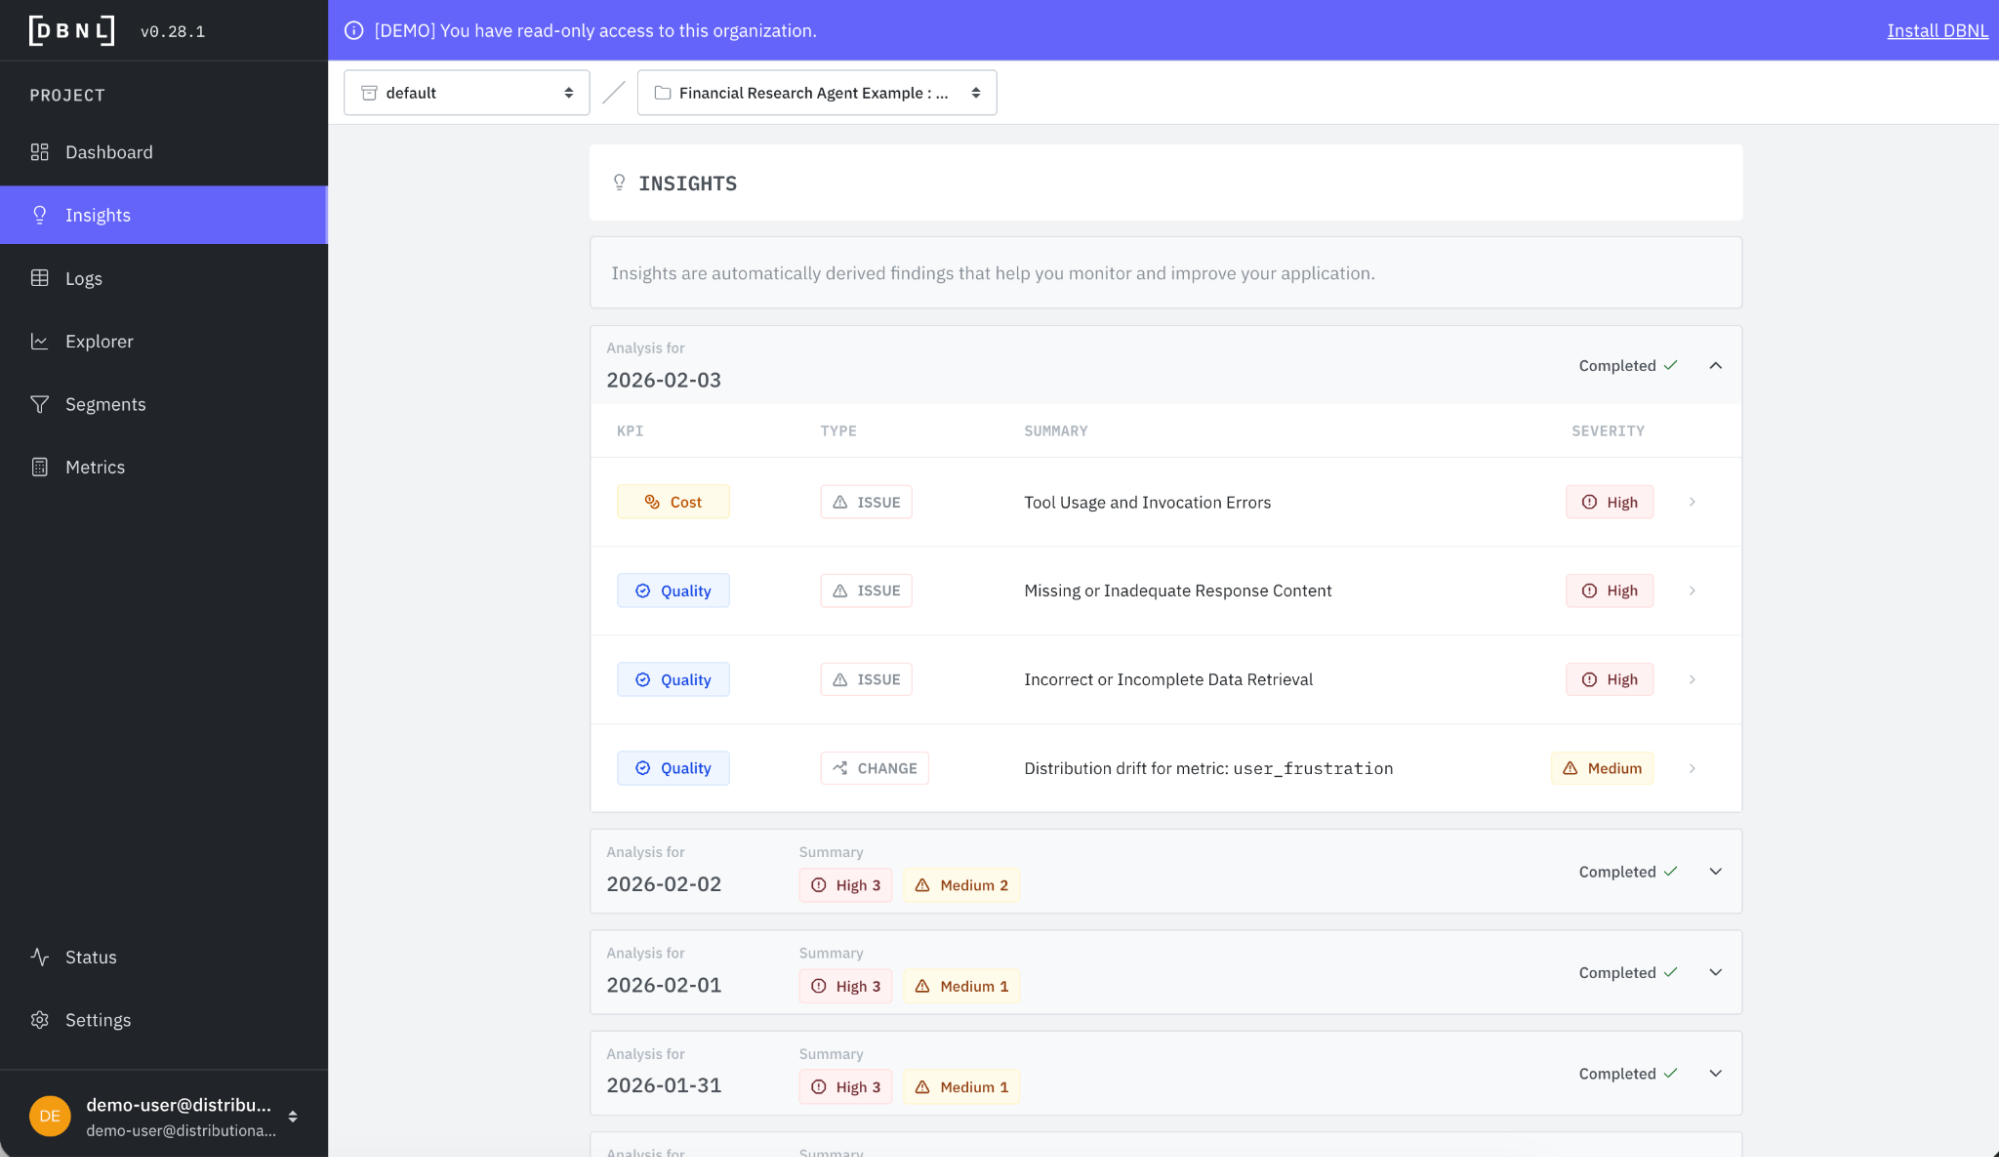
DBNL provides this deeper understanding of agent behavior to ground more proactive insights on how this behavior is evolving over time, and what actions your team should take to fix or improve the agent. Each day, DBNL produces a new collection of Insights with a quick summary of the type of insight, the KPI it impacts, and its severity for rapid triage.
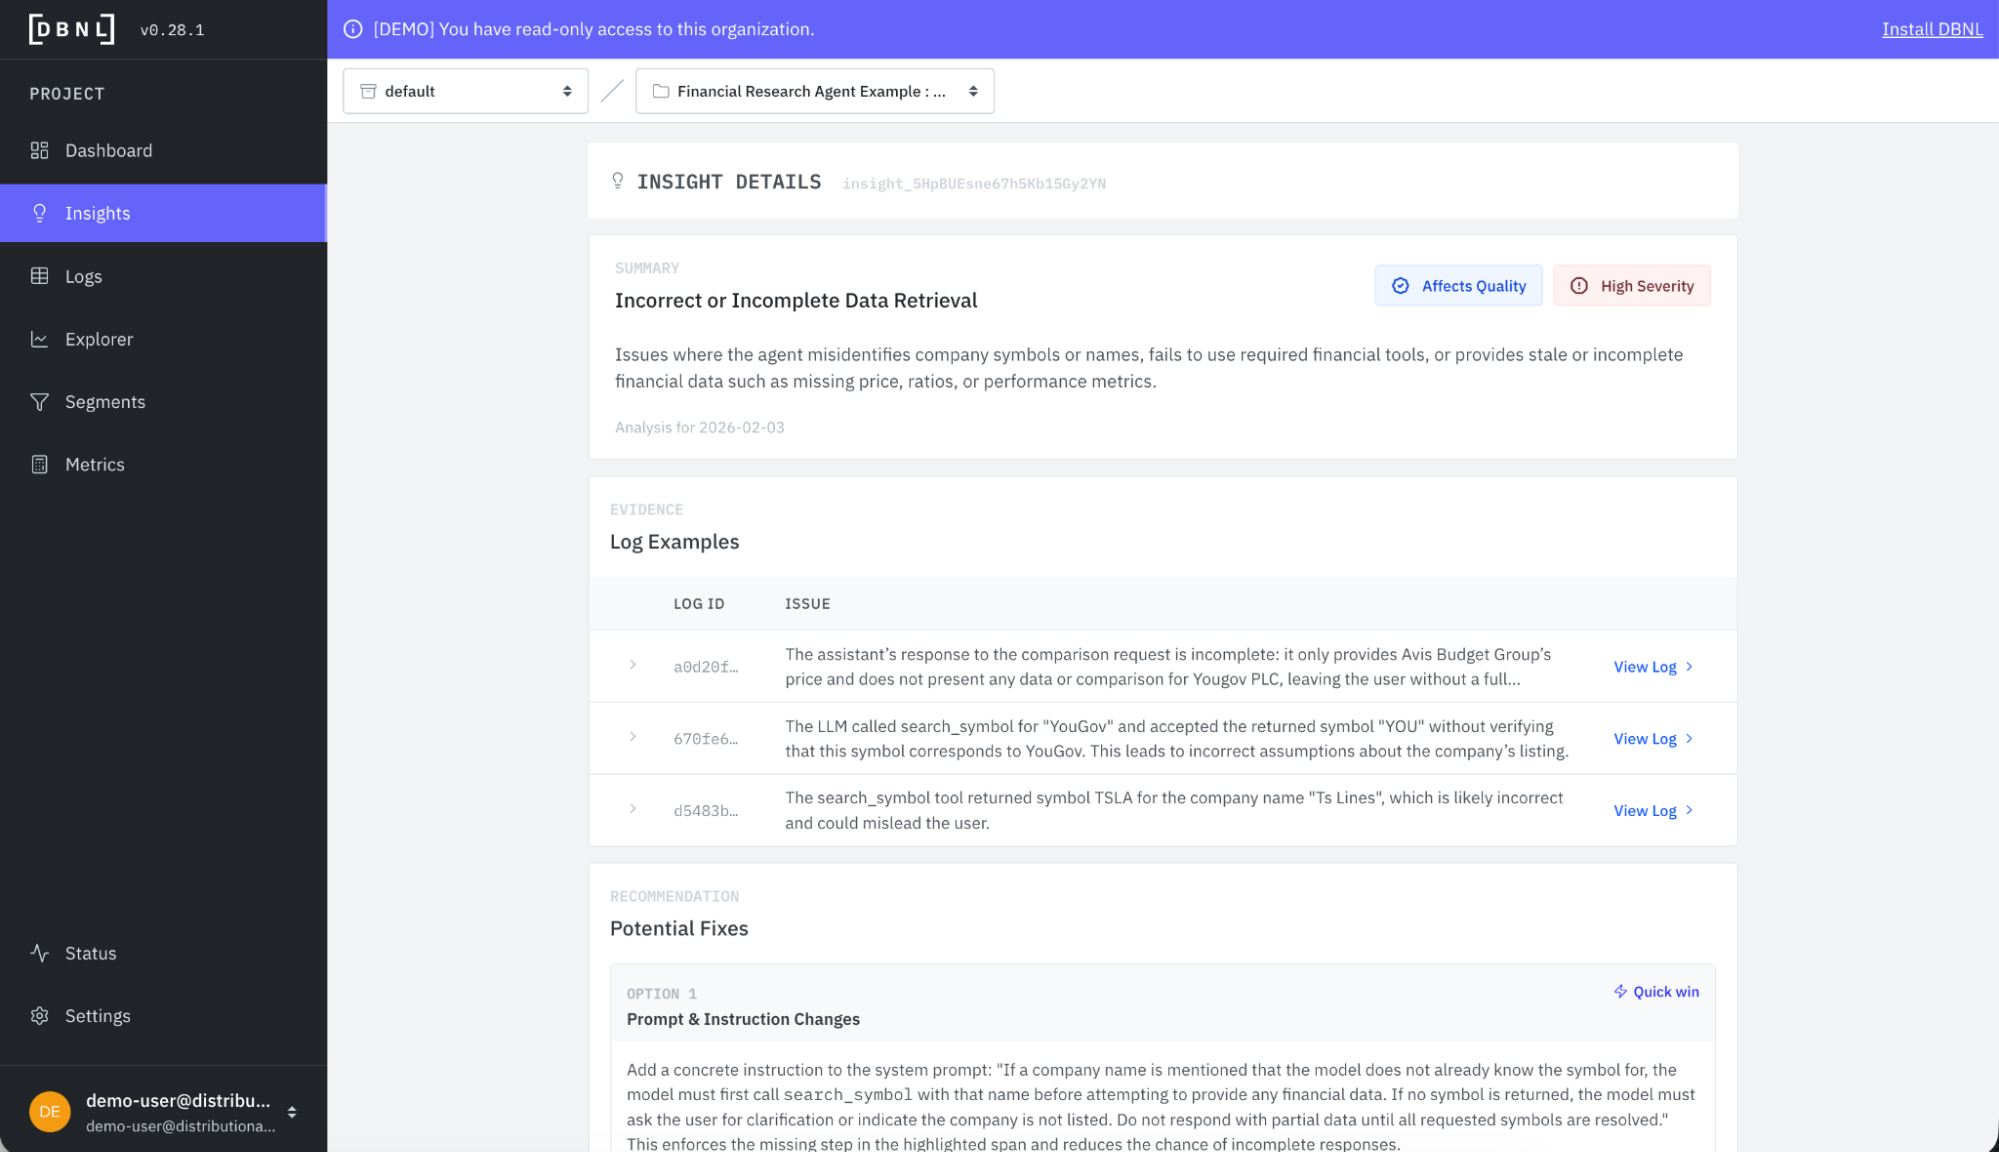
If we click into the “Incorrect or Incomplete Data Retrieval” insight, we get a deeper summary and selection of example logs that provide evidence supporting the insight. You see this insight refers to issues related to pulling the right stock symbol and other types of data retrieval issues with the agent.
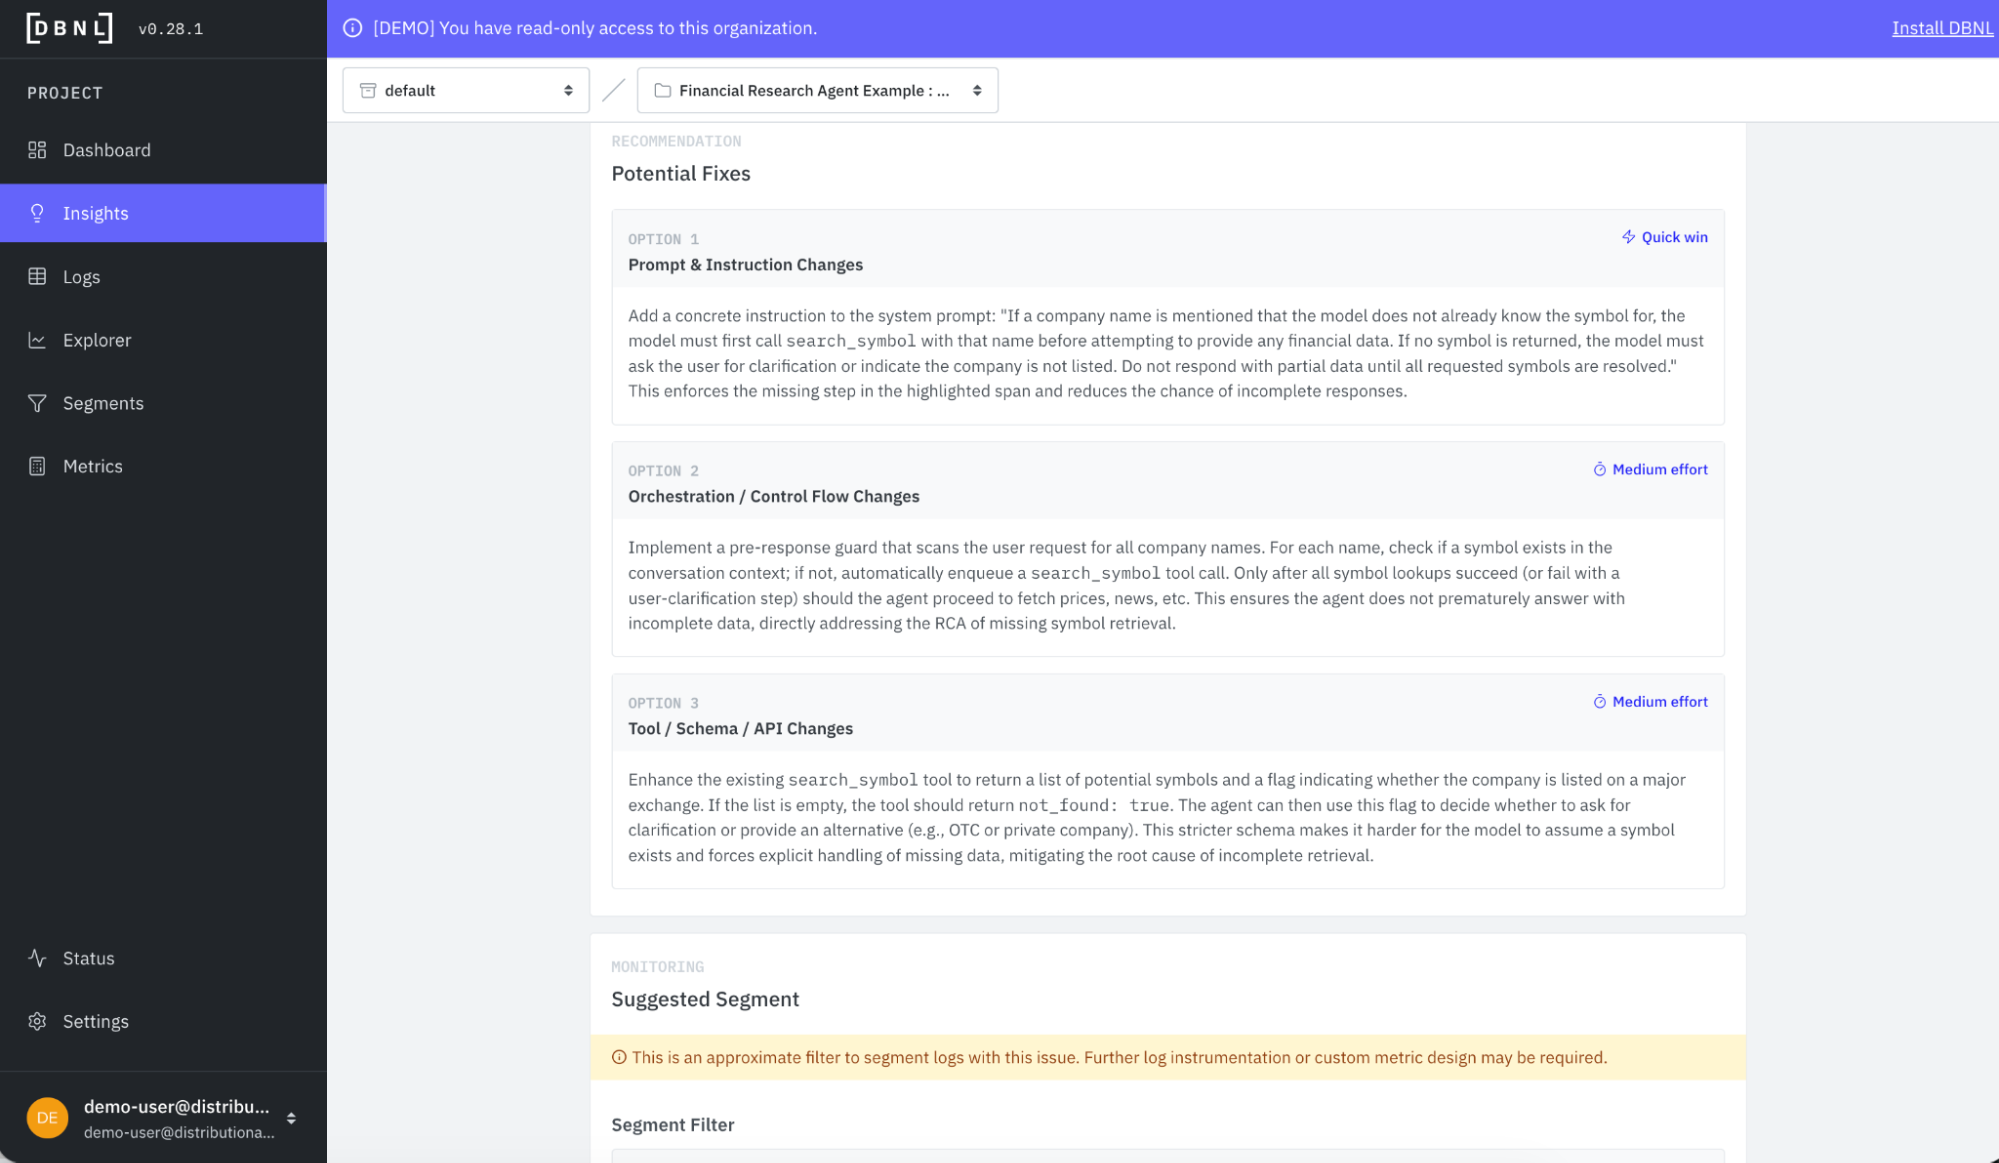
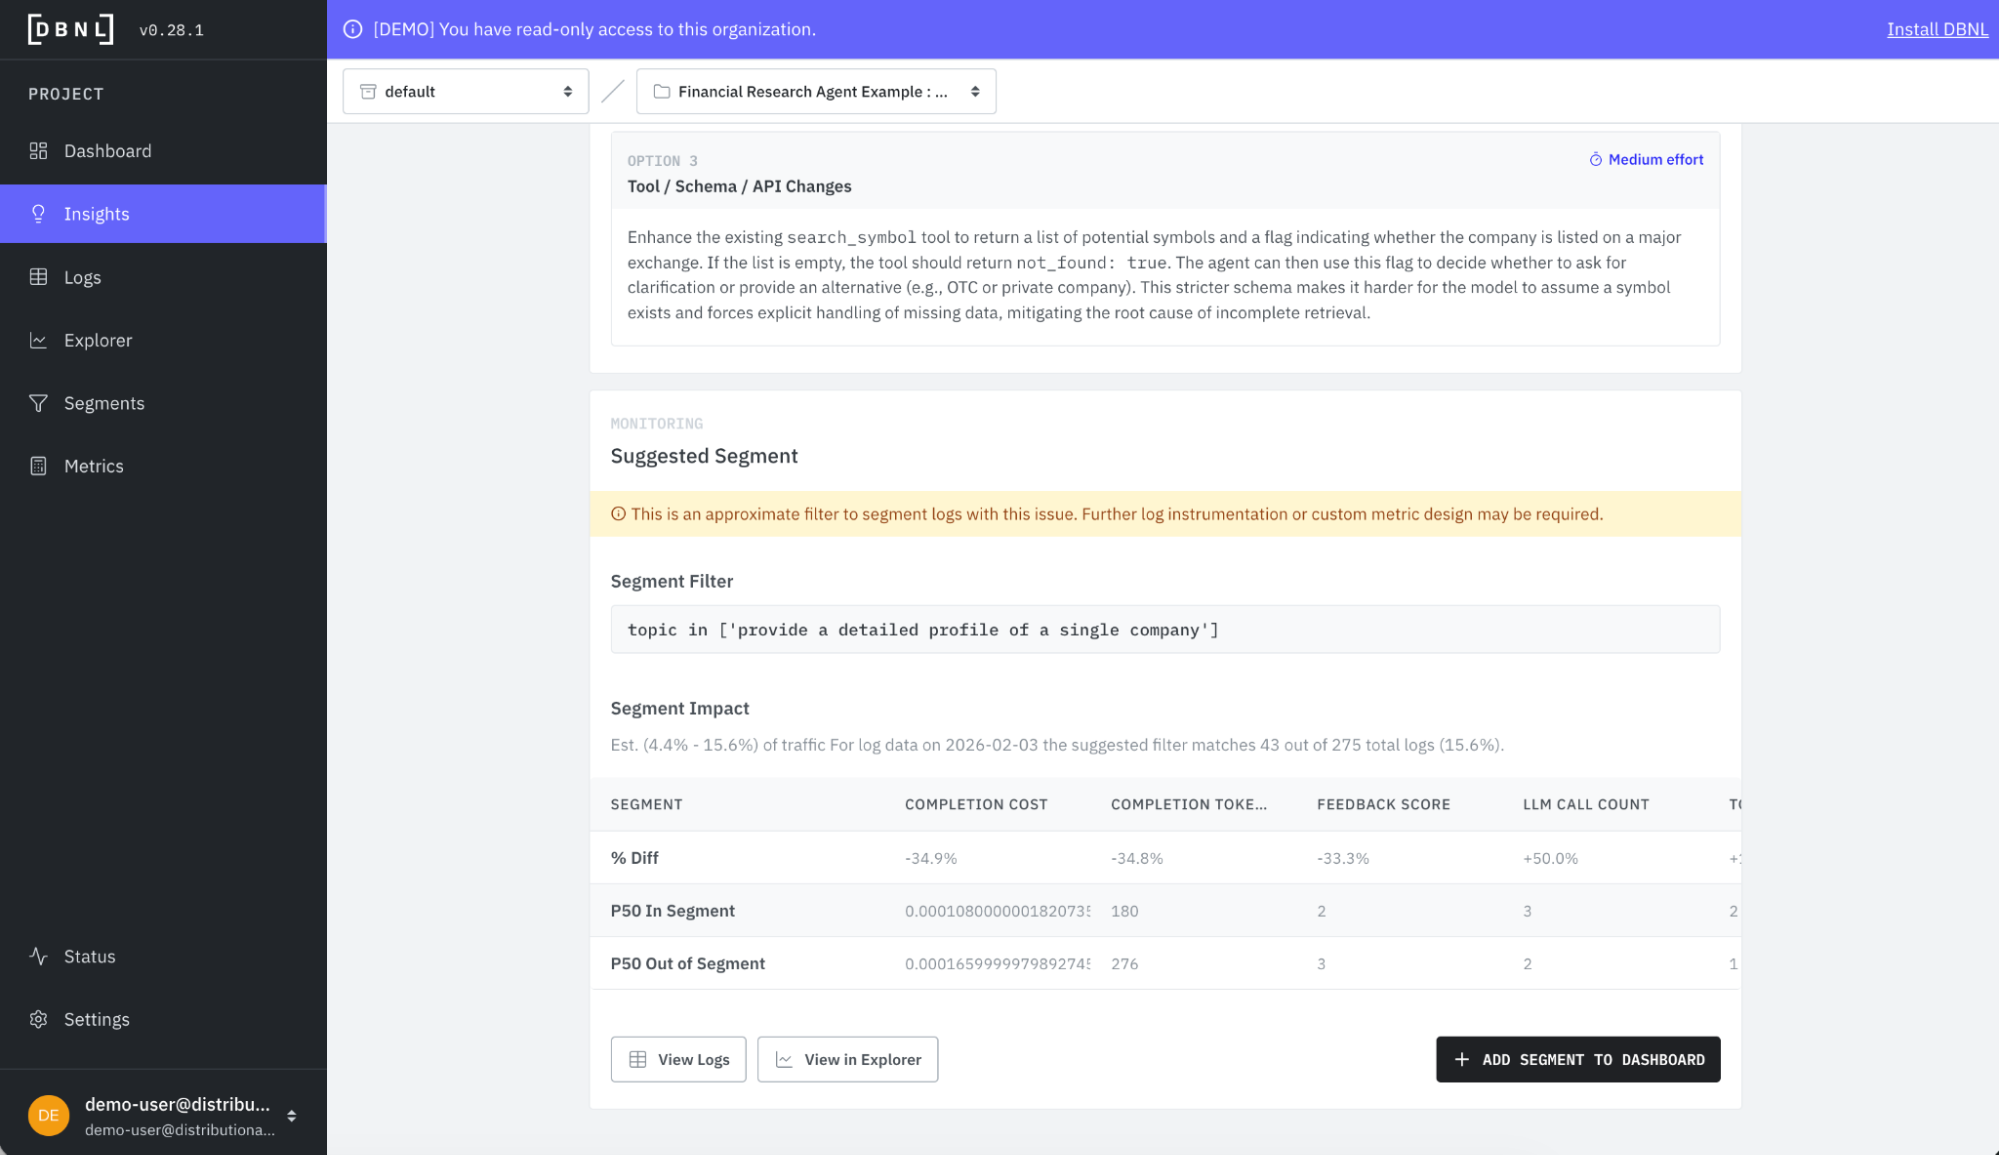
Embedded in this same insight card is also a set of recommendations with a light estimate of level of effort. This example shows prompt, orchestration, or tool changes that could improve performance.
Finally, the insight card also recommends a segment you can create to track the issue. This is particularly helpful for confirming that a change is having the desired impact—you’ll be able to see the relevant metrics for this particular segment respond to the change, or know that you need to try something else instead.
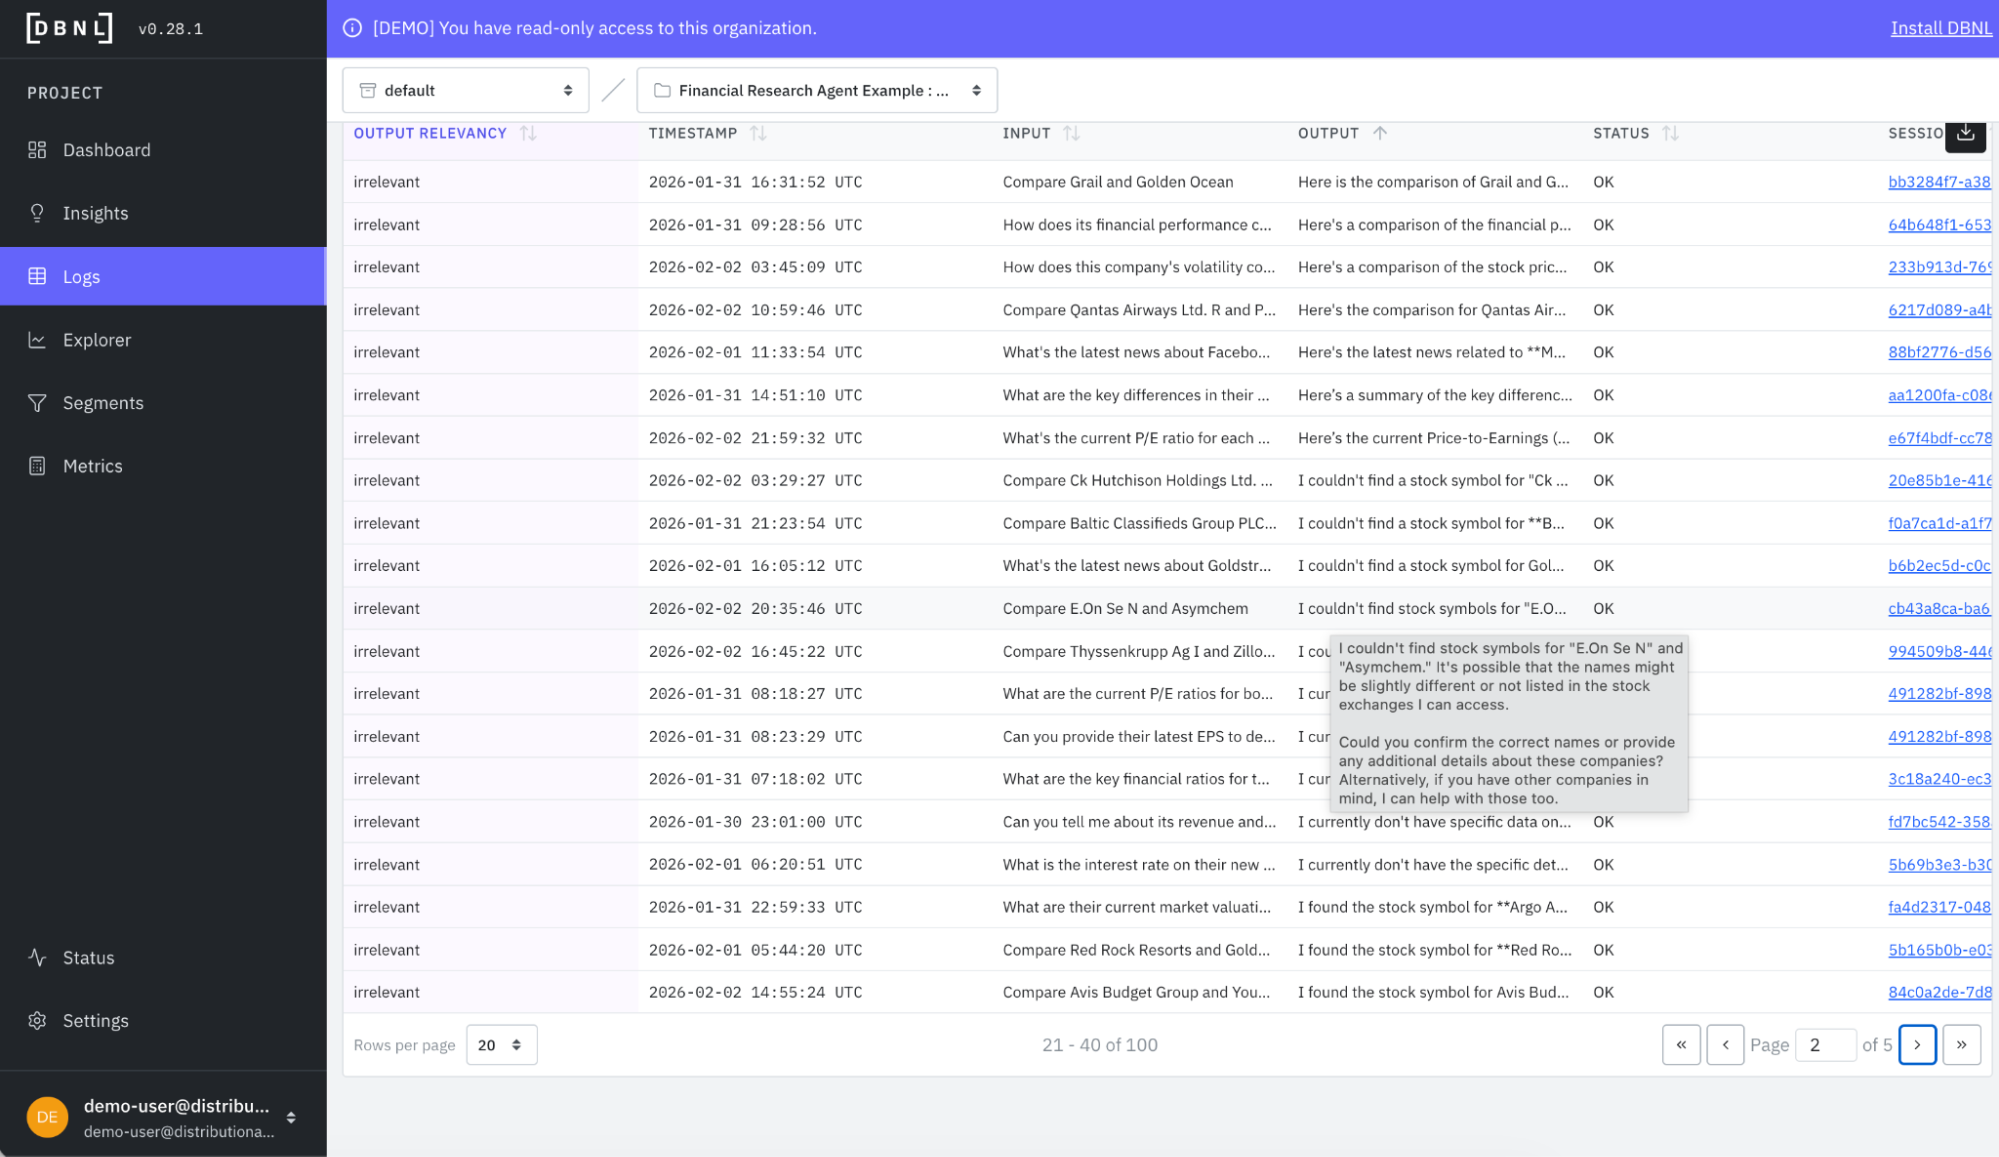
It is worth noting that you can also derive your own insights intuitively with DBNL by filtering the logs from the Dashboard or Explorer pages. Here is a quick example of filtering the financial research agent logs by output = irrelevant.
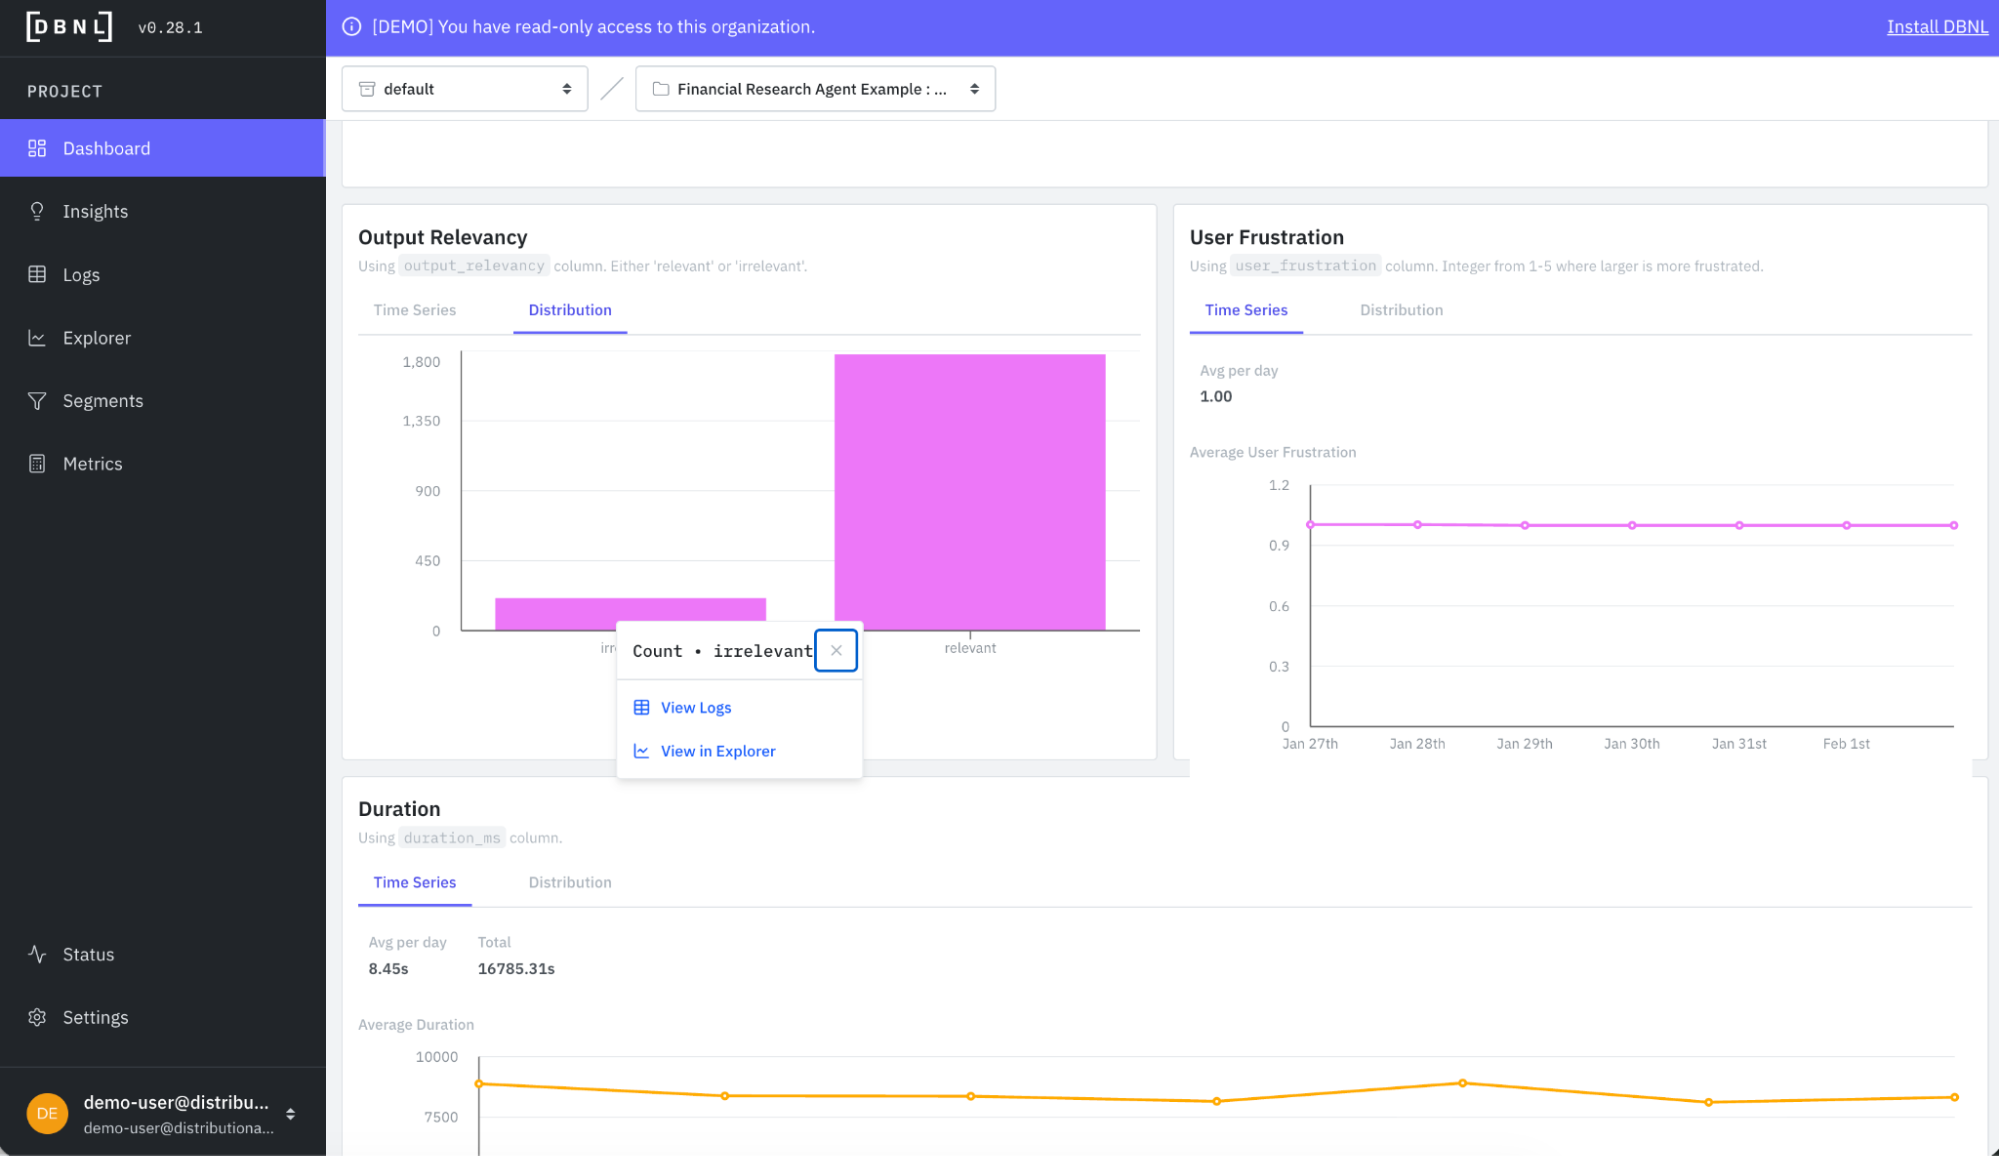
When you dig in, you quickly see many examples where the agent is reporting it couldn’t find the stock symbol, which may suggest an issue with the tools or how these tools are being called by the agent.
Get started
The goal of using DBNL’s analytics on production agent traces is to help you find the unknown unknowns so you can proactively fix, improve, or change your agent. These daily insights on agent behavior complement logging and monitoring to complete the AI observability stack. And these analytics facilitate a more active approach to agent governance, which, in turn, gives AI product teams the tools they need to confidently scale agent usage in production.
The easiest way to get started is to use a free SaaS demo account to review this example and other examples that we’ve pre-loaded in Distributional. Next, you can install our sandbox locally on your laptop in ten minutes and run through a tutorial that shows you how to use Distributional for a toy example. Once more familiar with our functionality, you can install the full service for free using a Terraform Module or Helm Chart. We are happy to help through any step of this process, so reach out at support@distributional.com with any questions.
Subscribe to DBNL
Thank you for your submission!
Oops! Something went wrong while submitting the form.