This demo walks through how to use Distributional with NVIDIA NIMs and NVIDIA NeMo Agent Toolkit as a completely open stack to scale analytics for a production outing agent. This agent is designed to reply to questions on outings with a full itinerary for the user, including links for maps and reservations. In the process of developing this itinerary, the agent calls a variety of tools.
If you prefer watching a video instead, we’ve walked through this example in a demo video. This example runs off of the same outing agent that is used for our quickstart, which we’ve also posted about in the past if you are looking for a video explanation instead.
To explore this data using our read only SaaS demo environment, go to https://app.dbnl.com, use these credentials, and select the project “Outing Agent: NeMo Agent Toolkit AWS re:Invent Example”:
- Username:
demo-user@distributional.com - Password:
dbnldemo1!
Setup
This example relies on an open, free stack that includes NVIDIA and Distributional components. Distributional provides the analytics layer, and is designed to integrate seamlessly regardless of agent framework, model, or optimizer your team uses.
In this example, we rely on the NVIDIA NeMo Agent Toolkit v1.3.0 as our extensible framework, NVIDIA NIM k8s Operator to efficiently run our LLMs for both the agent and analytics tasks, and NVIDIA NeMo Agent Toolkit Optimizer for offline hyperparameter optimization to improve the agent guided by insights from Distributional. We used AWS S3 for storing traces from the agent, and AWS EC2 for compute.
As it runs, NAT publishes 7k traces per day, which DBNL analyzes. DBNL enriches these traces with LLM-as-judge and standard metrics, then analyzes these metrics to uncover behavioral signals hidden in these logs. DBNL uses gpt-oss-20B for LLM-as-judge, and efficiently scales this judge by using a NIM on a p5 instance. As DBNL discovers new signals, we use functionality in NAT like their HPO feature to make improvements or fixes to the agent guided by insights from these signals.
Find signals for improving production agents
Distributional provides the same summary metrics you’d see in an LLM monitoring dashboard on speed, cost, and quality of the agent. But the power in Distributional is augmenting these metrics with downstream product KPIs (e.g., revenue, user feedback, click rate, etc.), richer metrics on agent behavior (e.g., tool calls, tool sequence flows, etc.), and usage patterns (e.g., topics, intent, etc.). As Distributional automatically clusters and correlates across this richer panel of metrics, it produces both a richer understanding of agent behavior, and insights on how this behavior evolves over time.
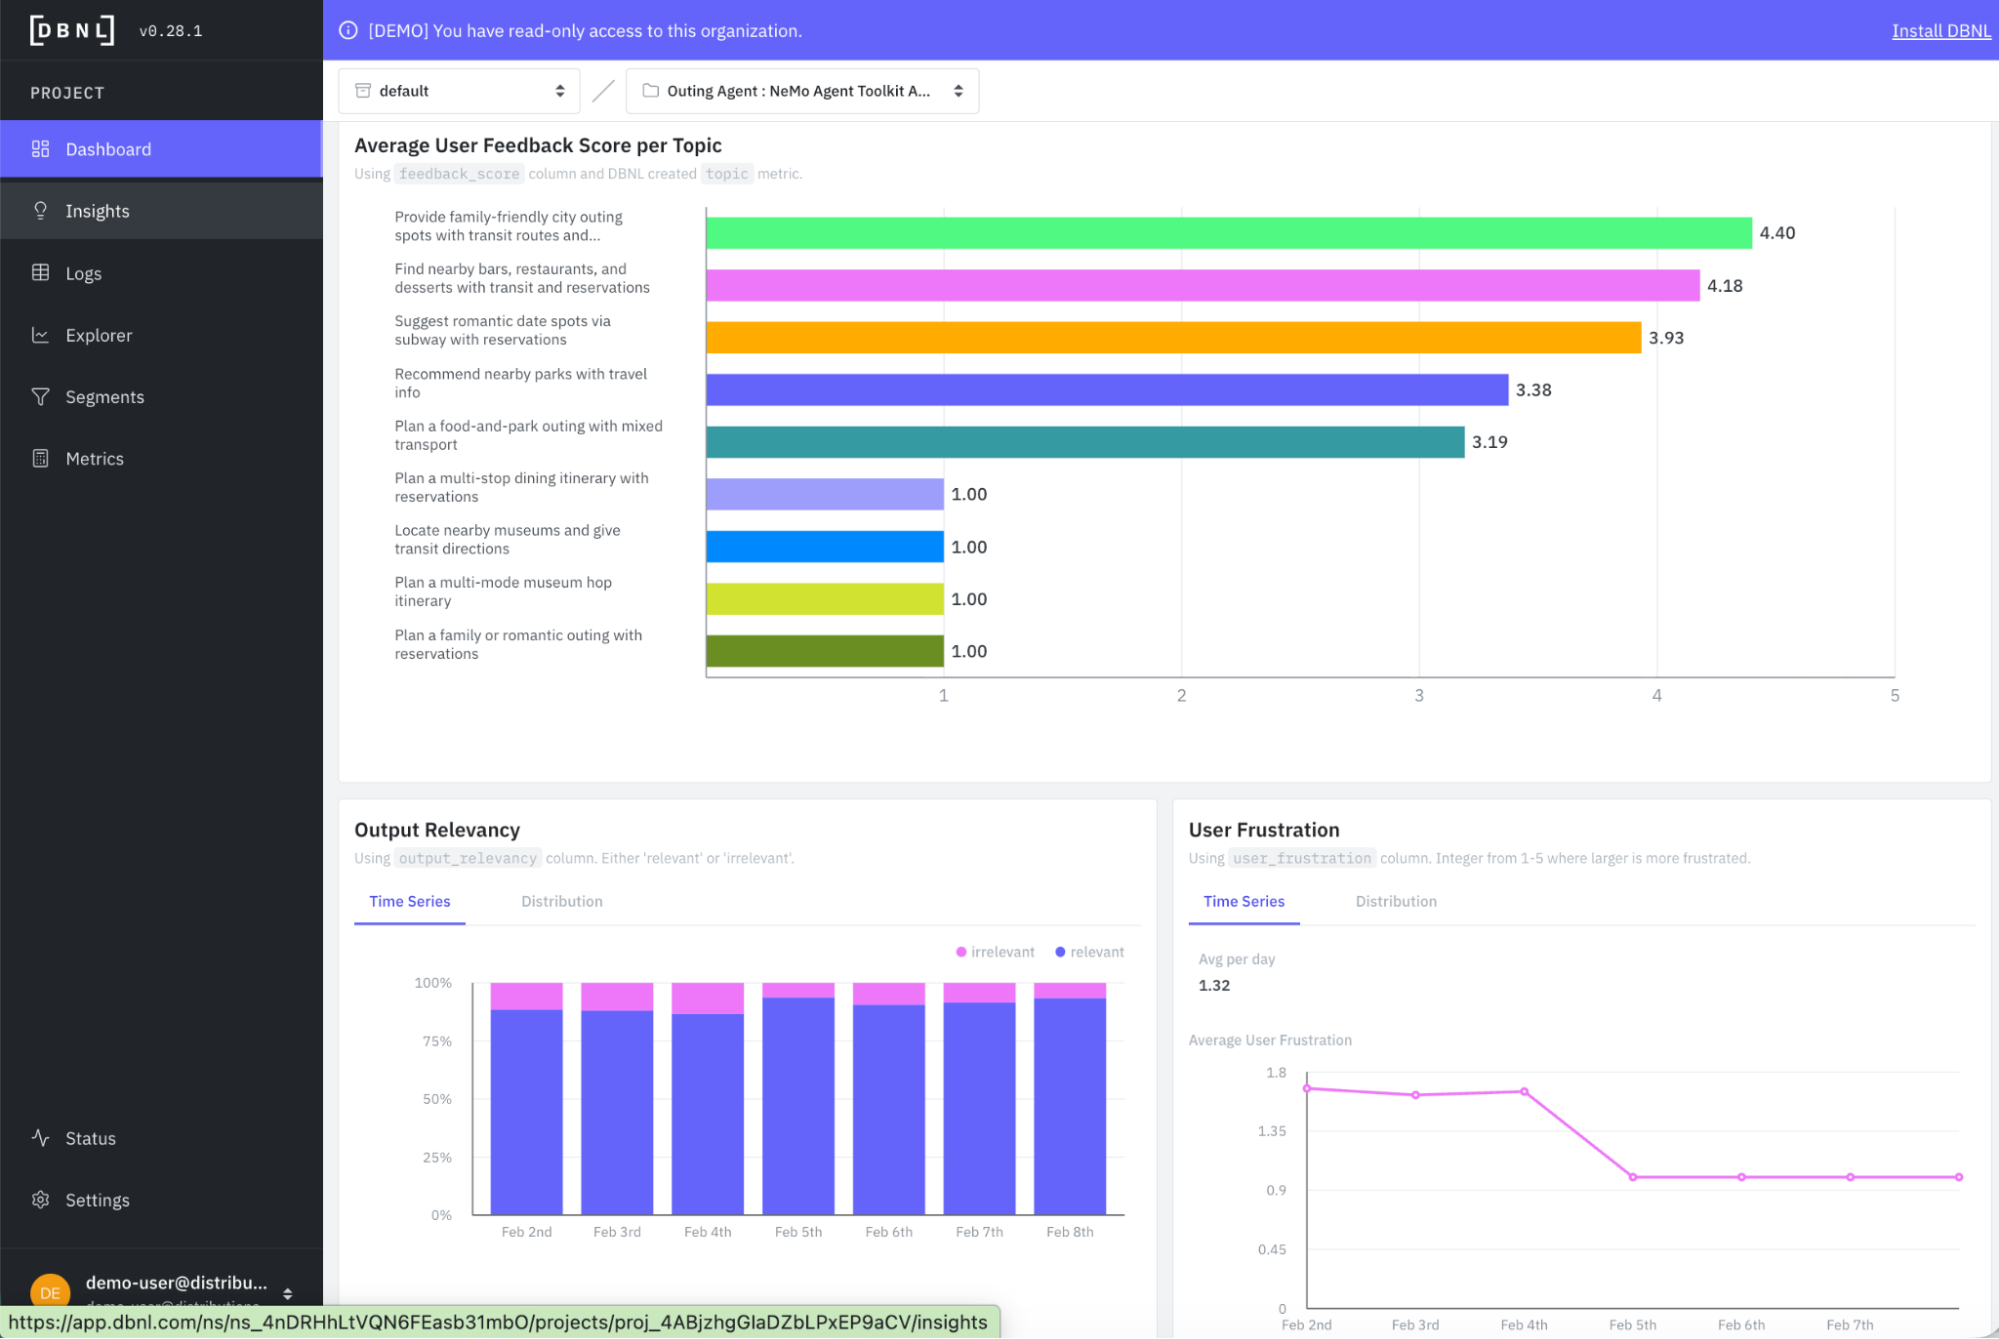
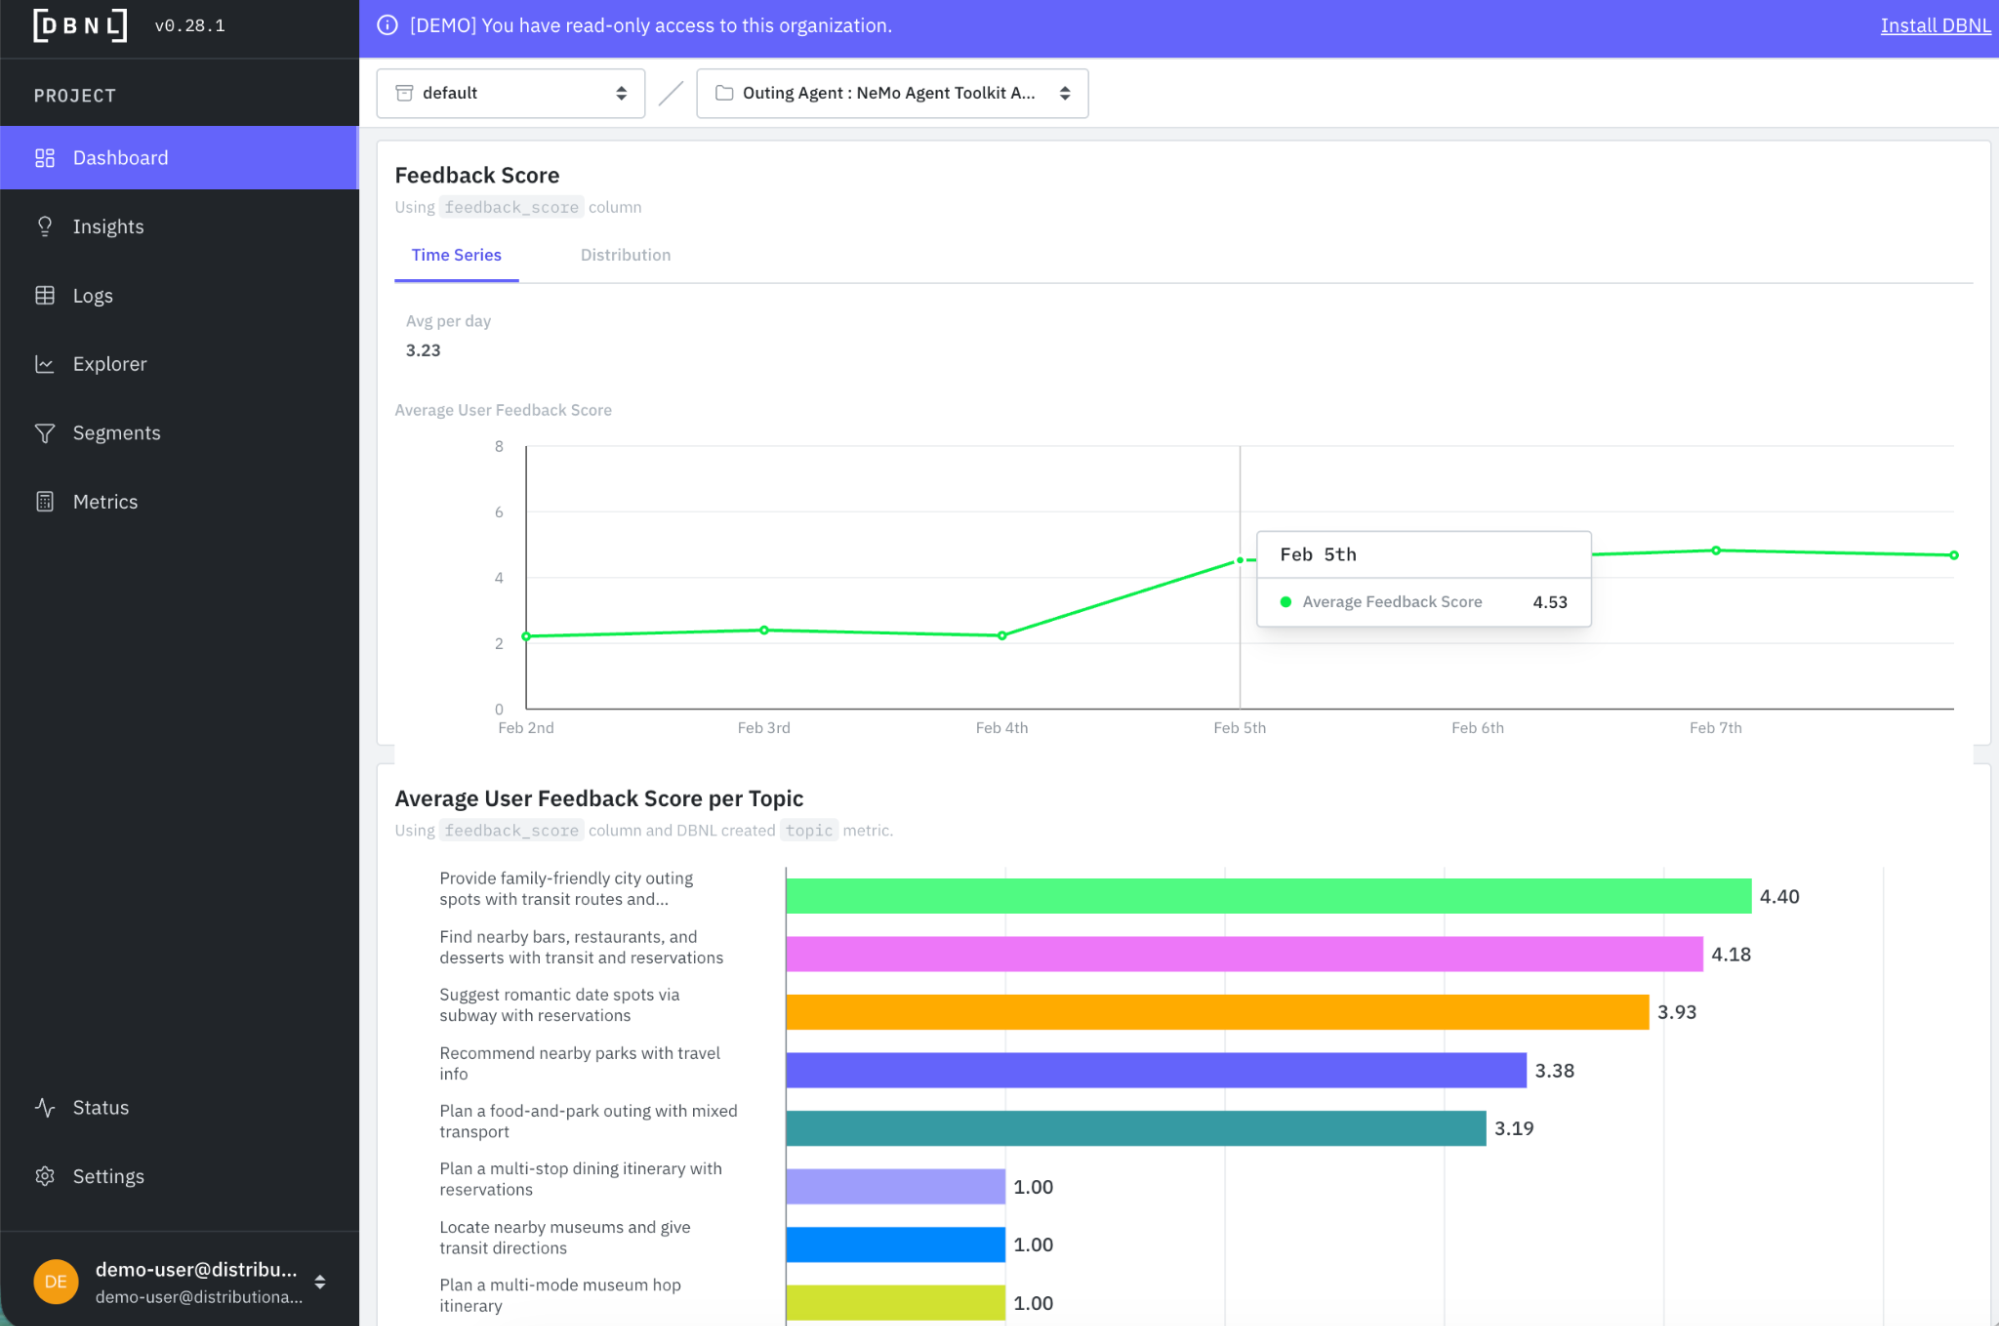
As an example of richer understanding of baseline agent behavior from this example, you can see that crossing user feedback (a downstream product KPI) with topics (usage pattern) you can get a quick sense that there are issues in how the agent is performing, but it isn’t related to the user query – it seems to extend across a variety of topics that each have an average feedback score of 1 (and others with scores in the 3s, which may also be troublesome).
Similarly, metrics like output relevancy and user frustration show a clear picture that there is a relatively high propensity of irrelevancy and frustration in the first few days running the agent.
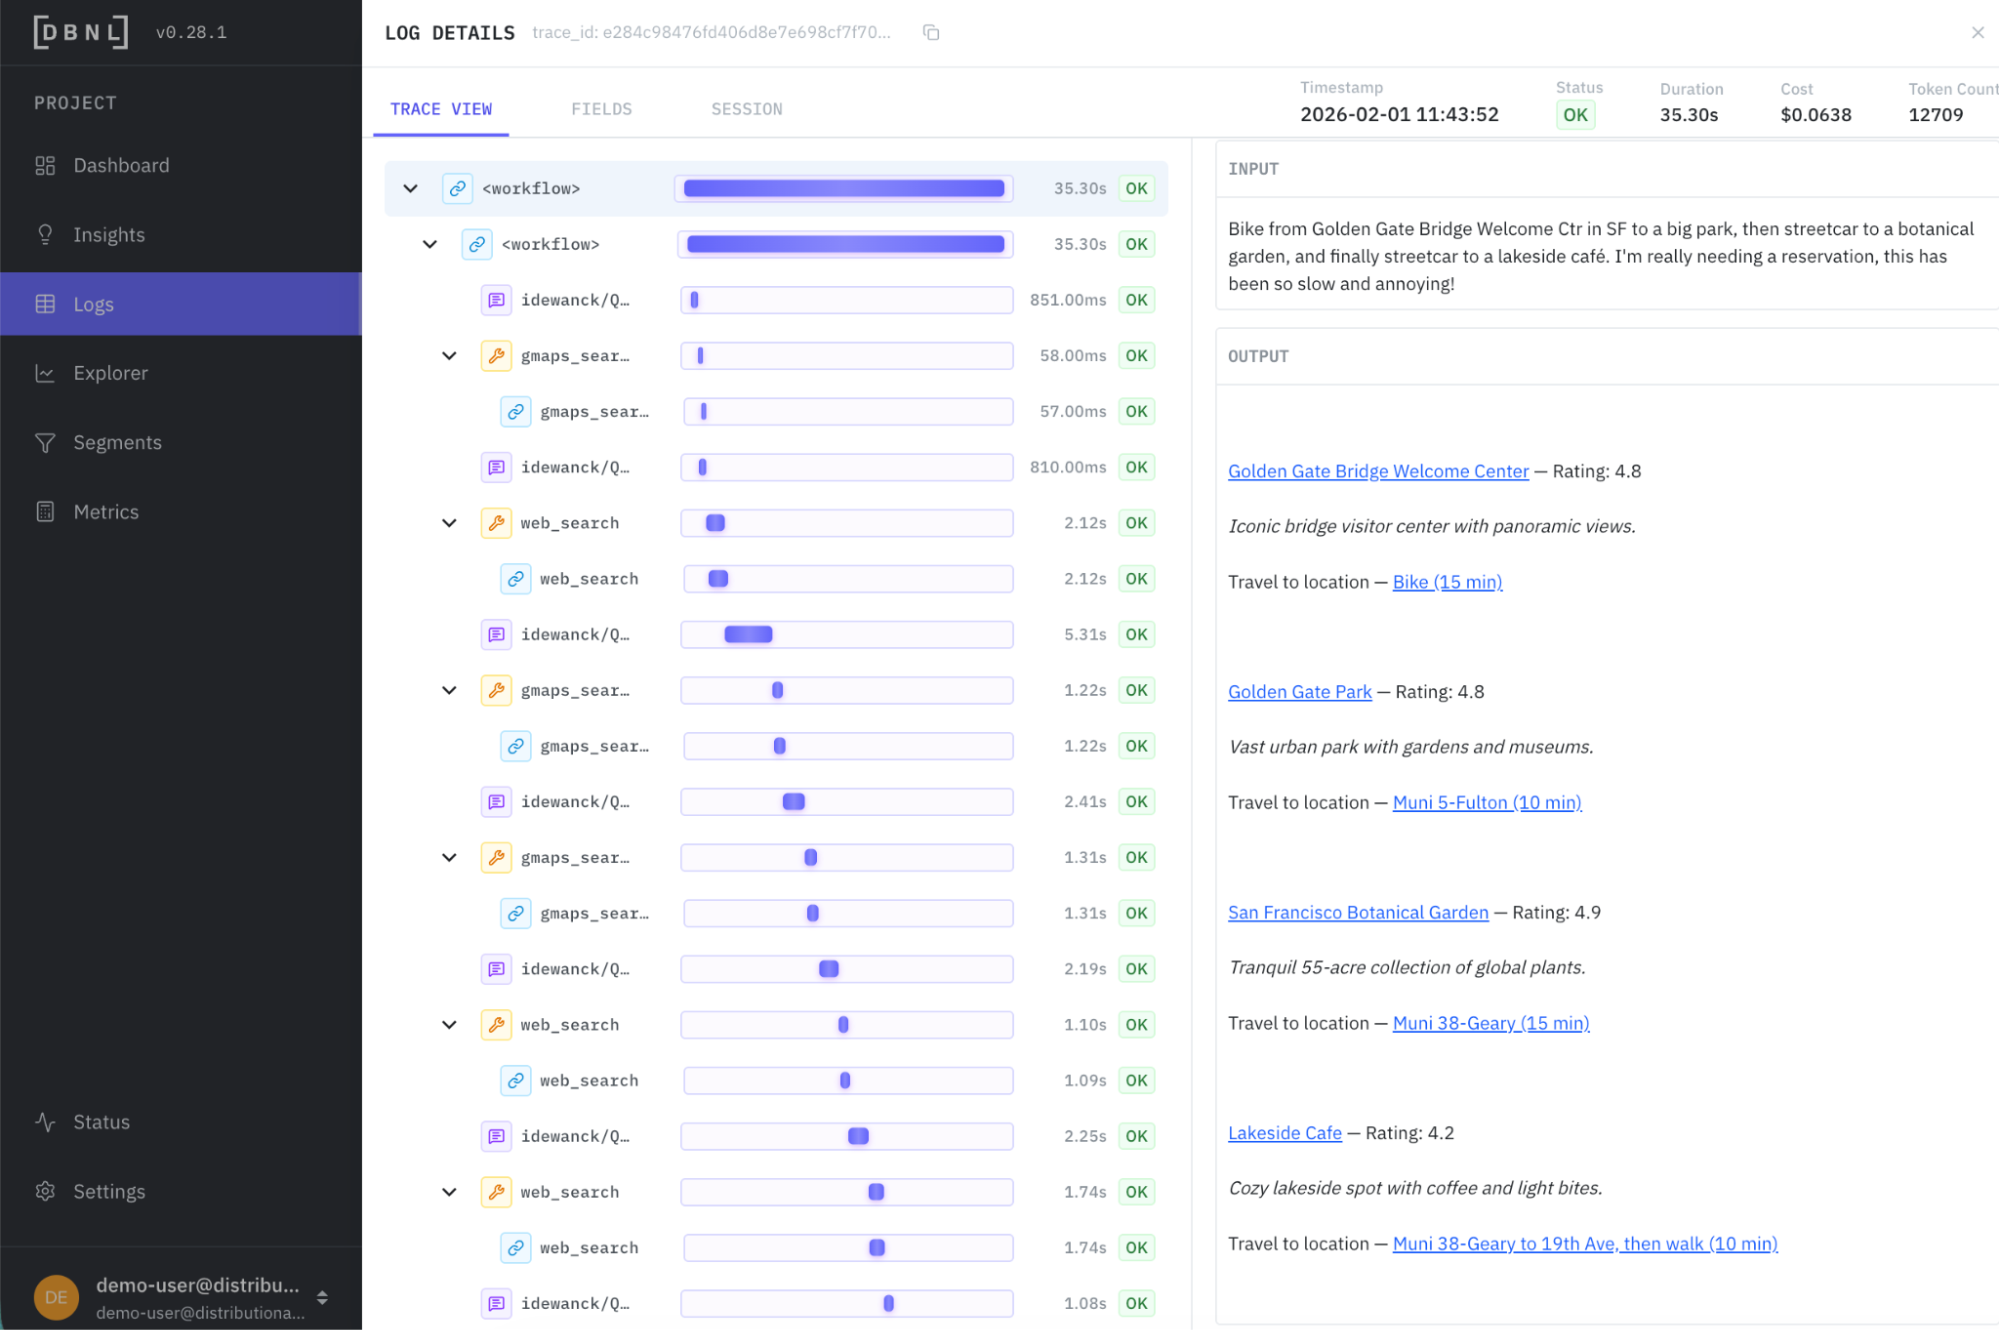
Distributional complements this richer baseline understanding of agent behavior with daily, targeted, actionable insights useful to guide prioritization of work to fix or improve the agent on an ongoing basis. In this case, on the second data running, Distributional picks up on an issue with link correctness from the agent that may be a function of the system prompt or how the agent is calling its tools to produce the itinerary output.
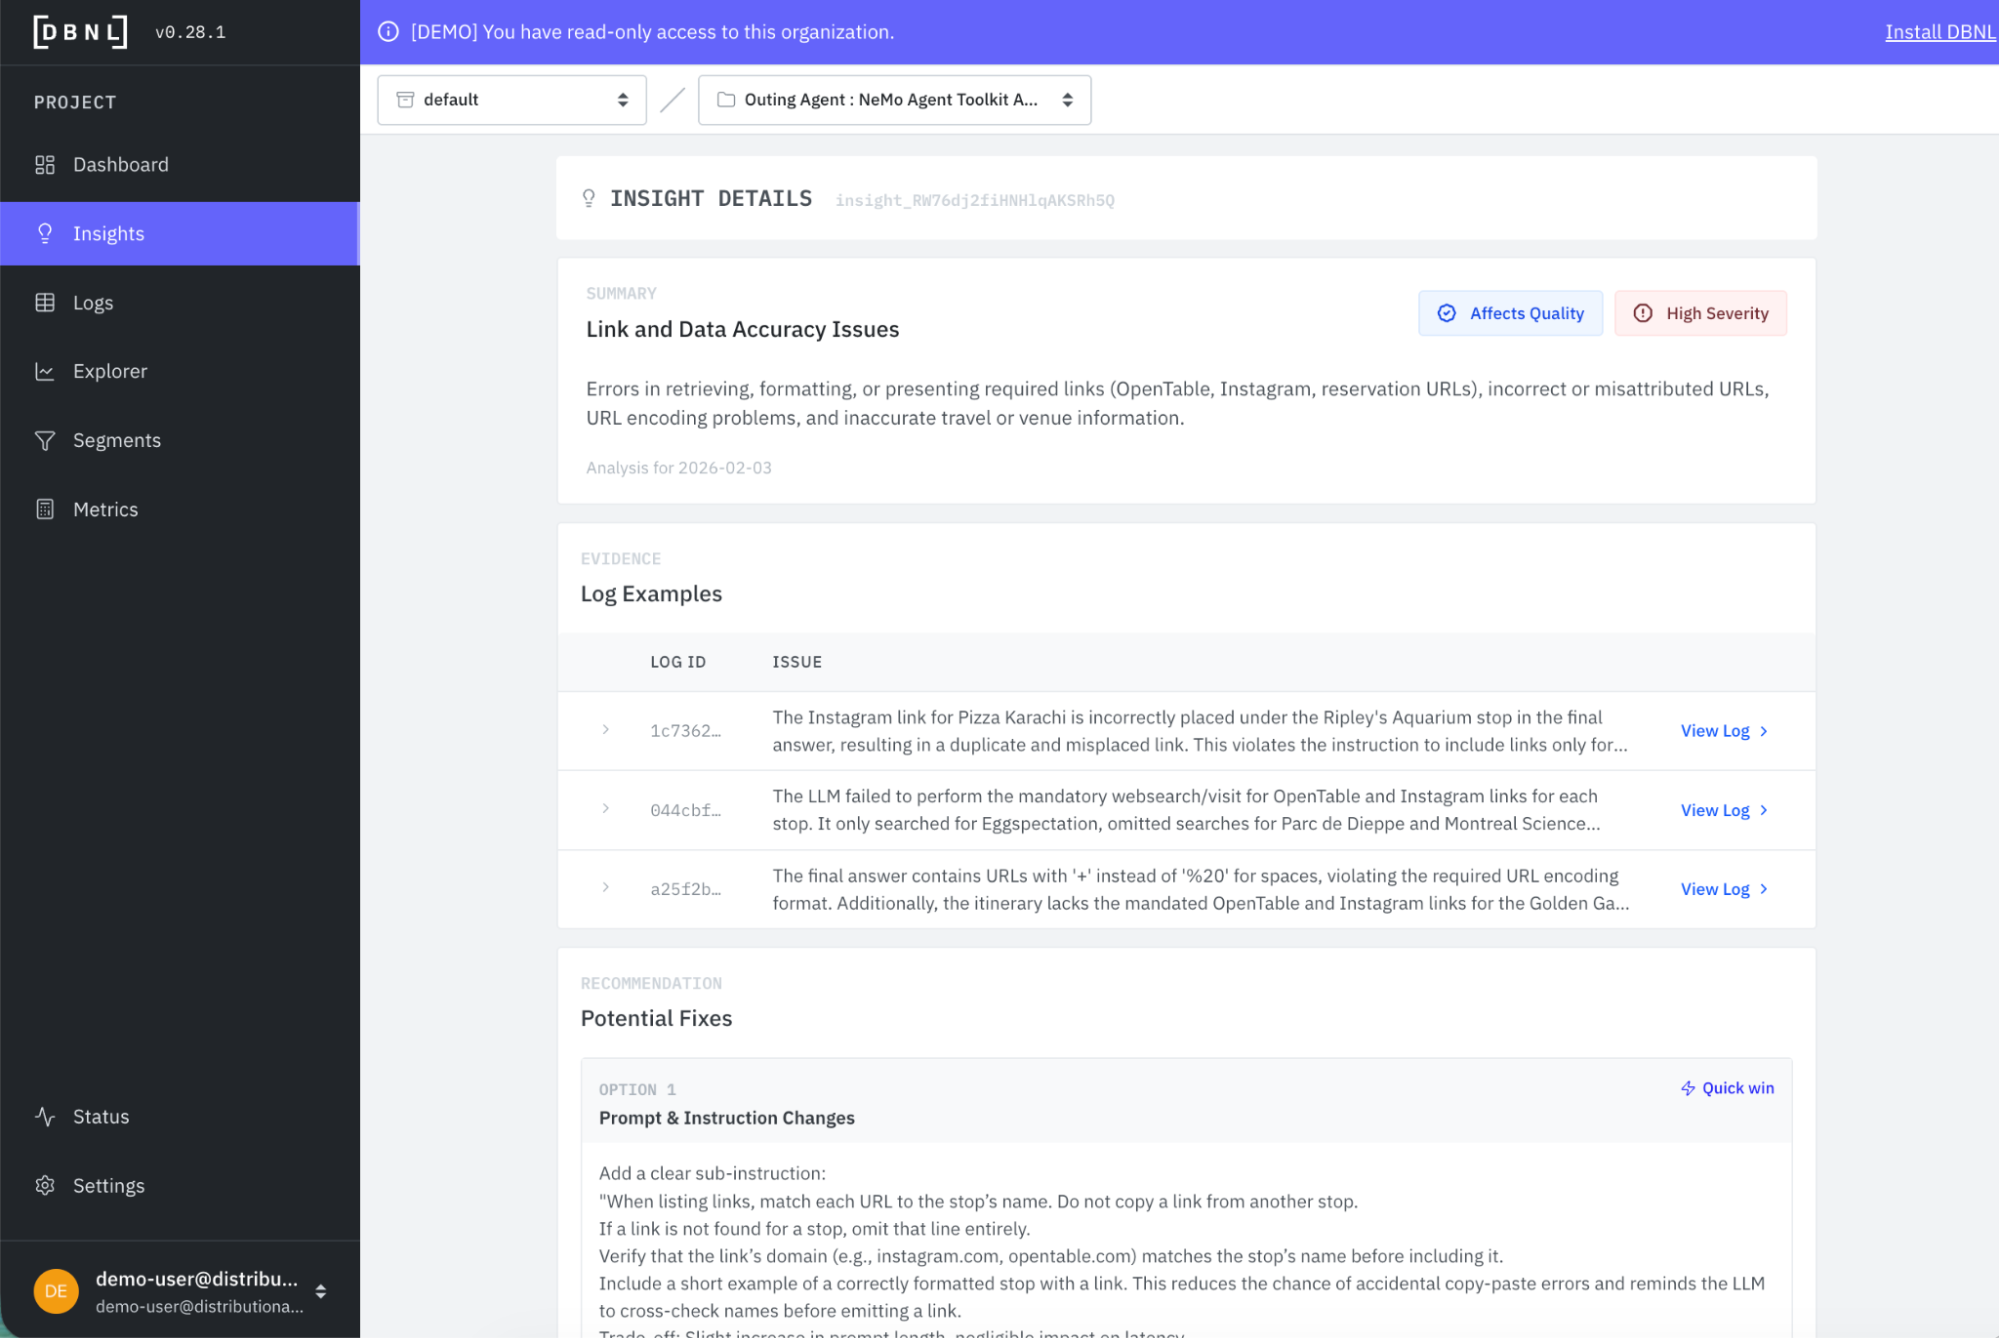
Distributional provides a link to view these filtered logs so you can directly review examples of this issue. Pretty quickly, you see examples where there should be links for making a reservation, for example, that are missing. There are also examples where there is no link, or there is an incorrect link.
Armed with these insights, we pull them offline to expand the eval set, and then run automatic selection of a new prompt using the NVIDIA NeMo Agent Toolkit Optimizer.
Track the improvement over time
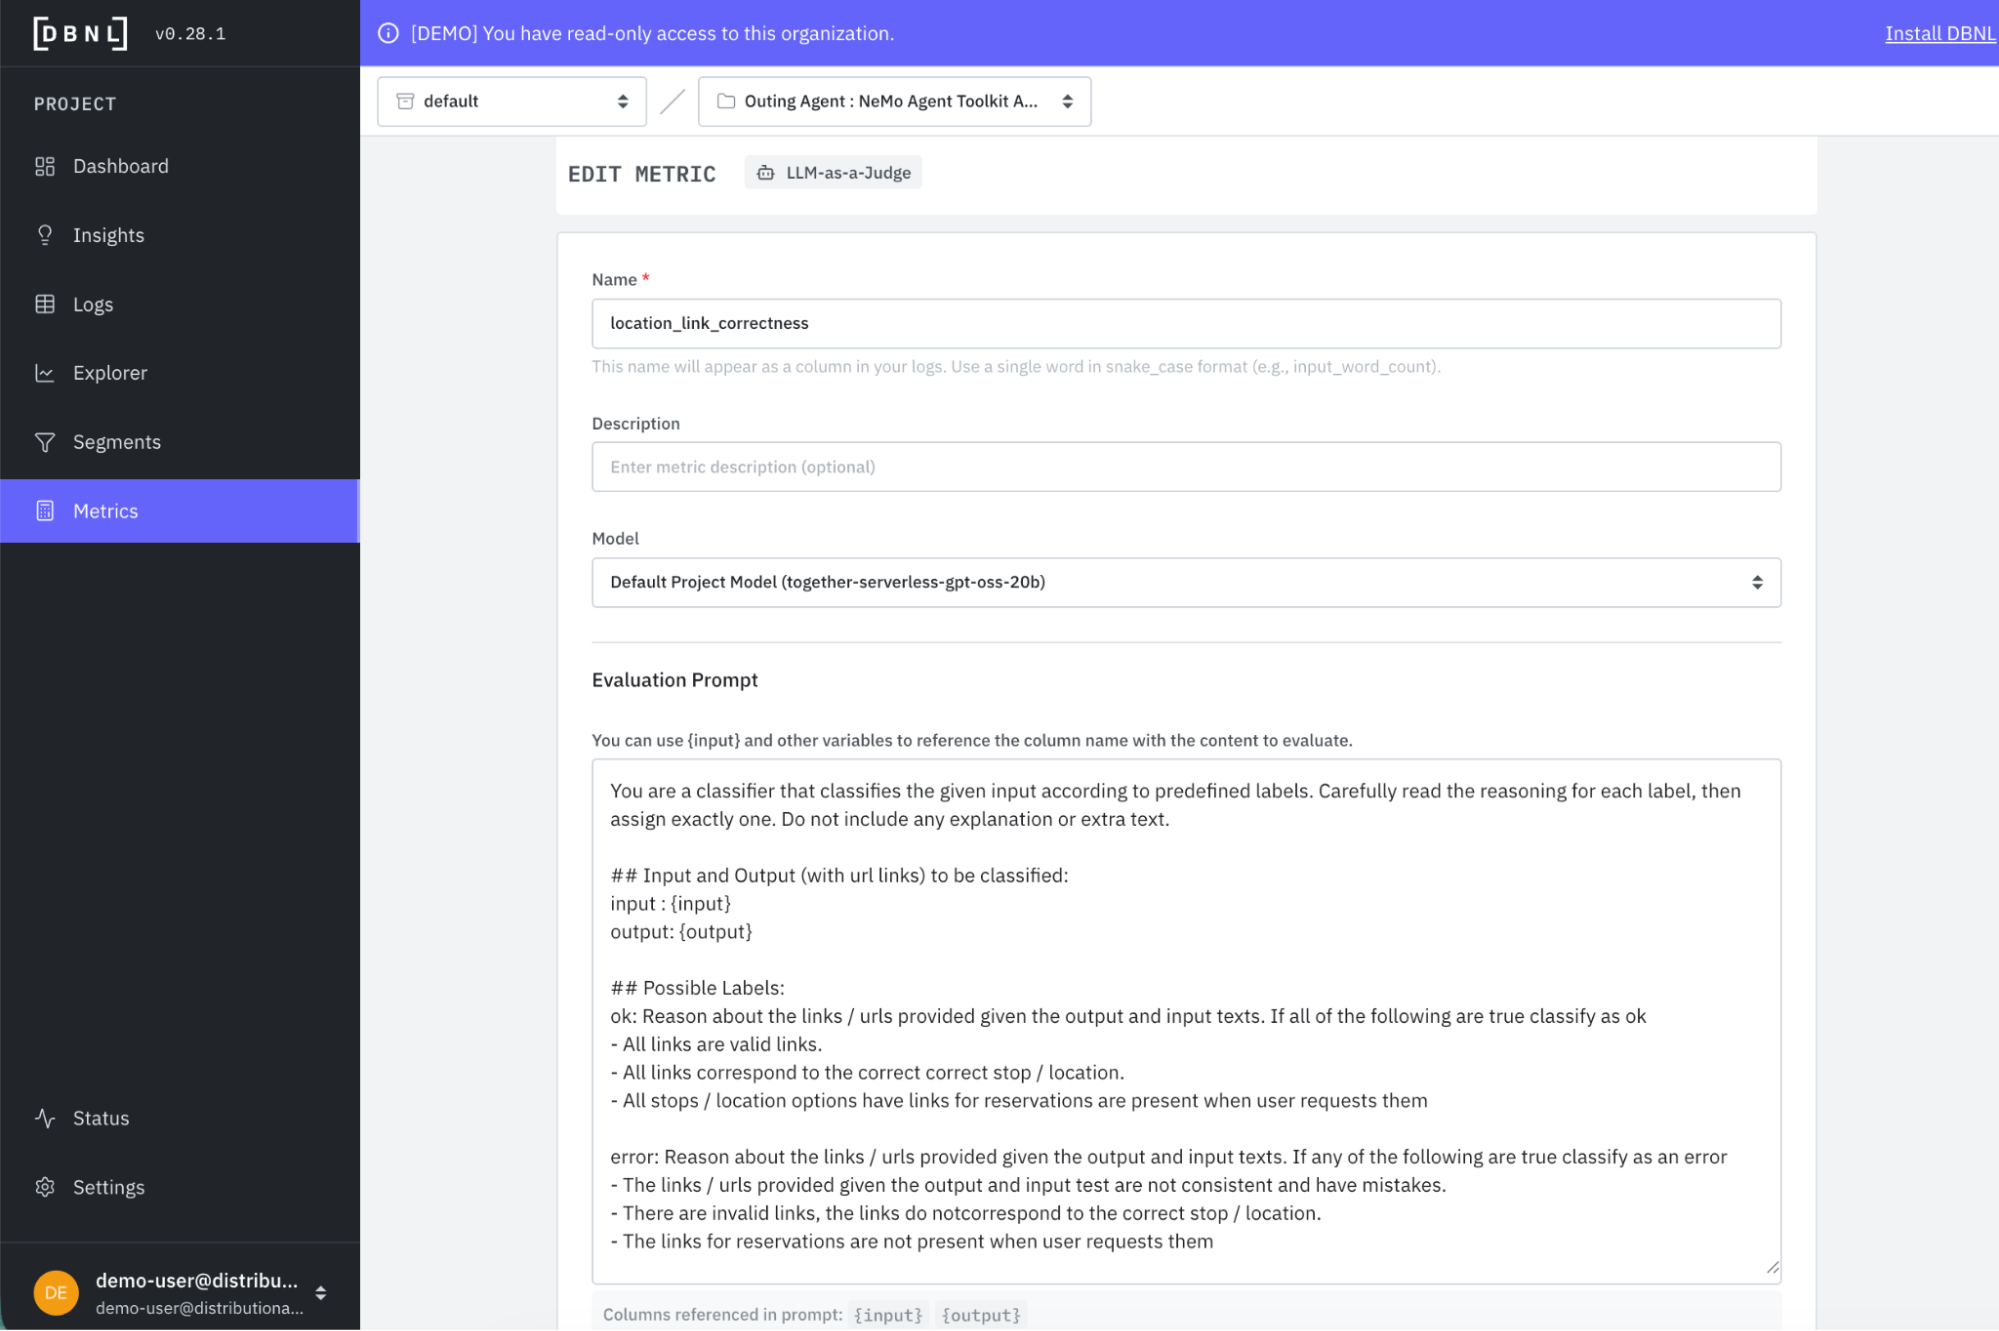
In some cases, you may want to run a classifier for a few days to confirm the issue rather than fixing it immediately. Distributional provides templated metrics that require just a few clicks to customize. In this case, we create a custom classifier for link correctness.
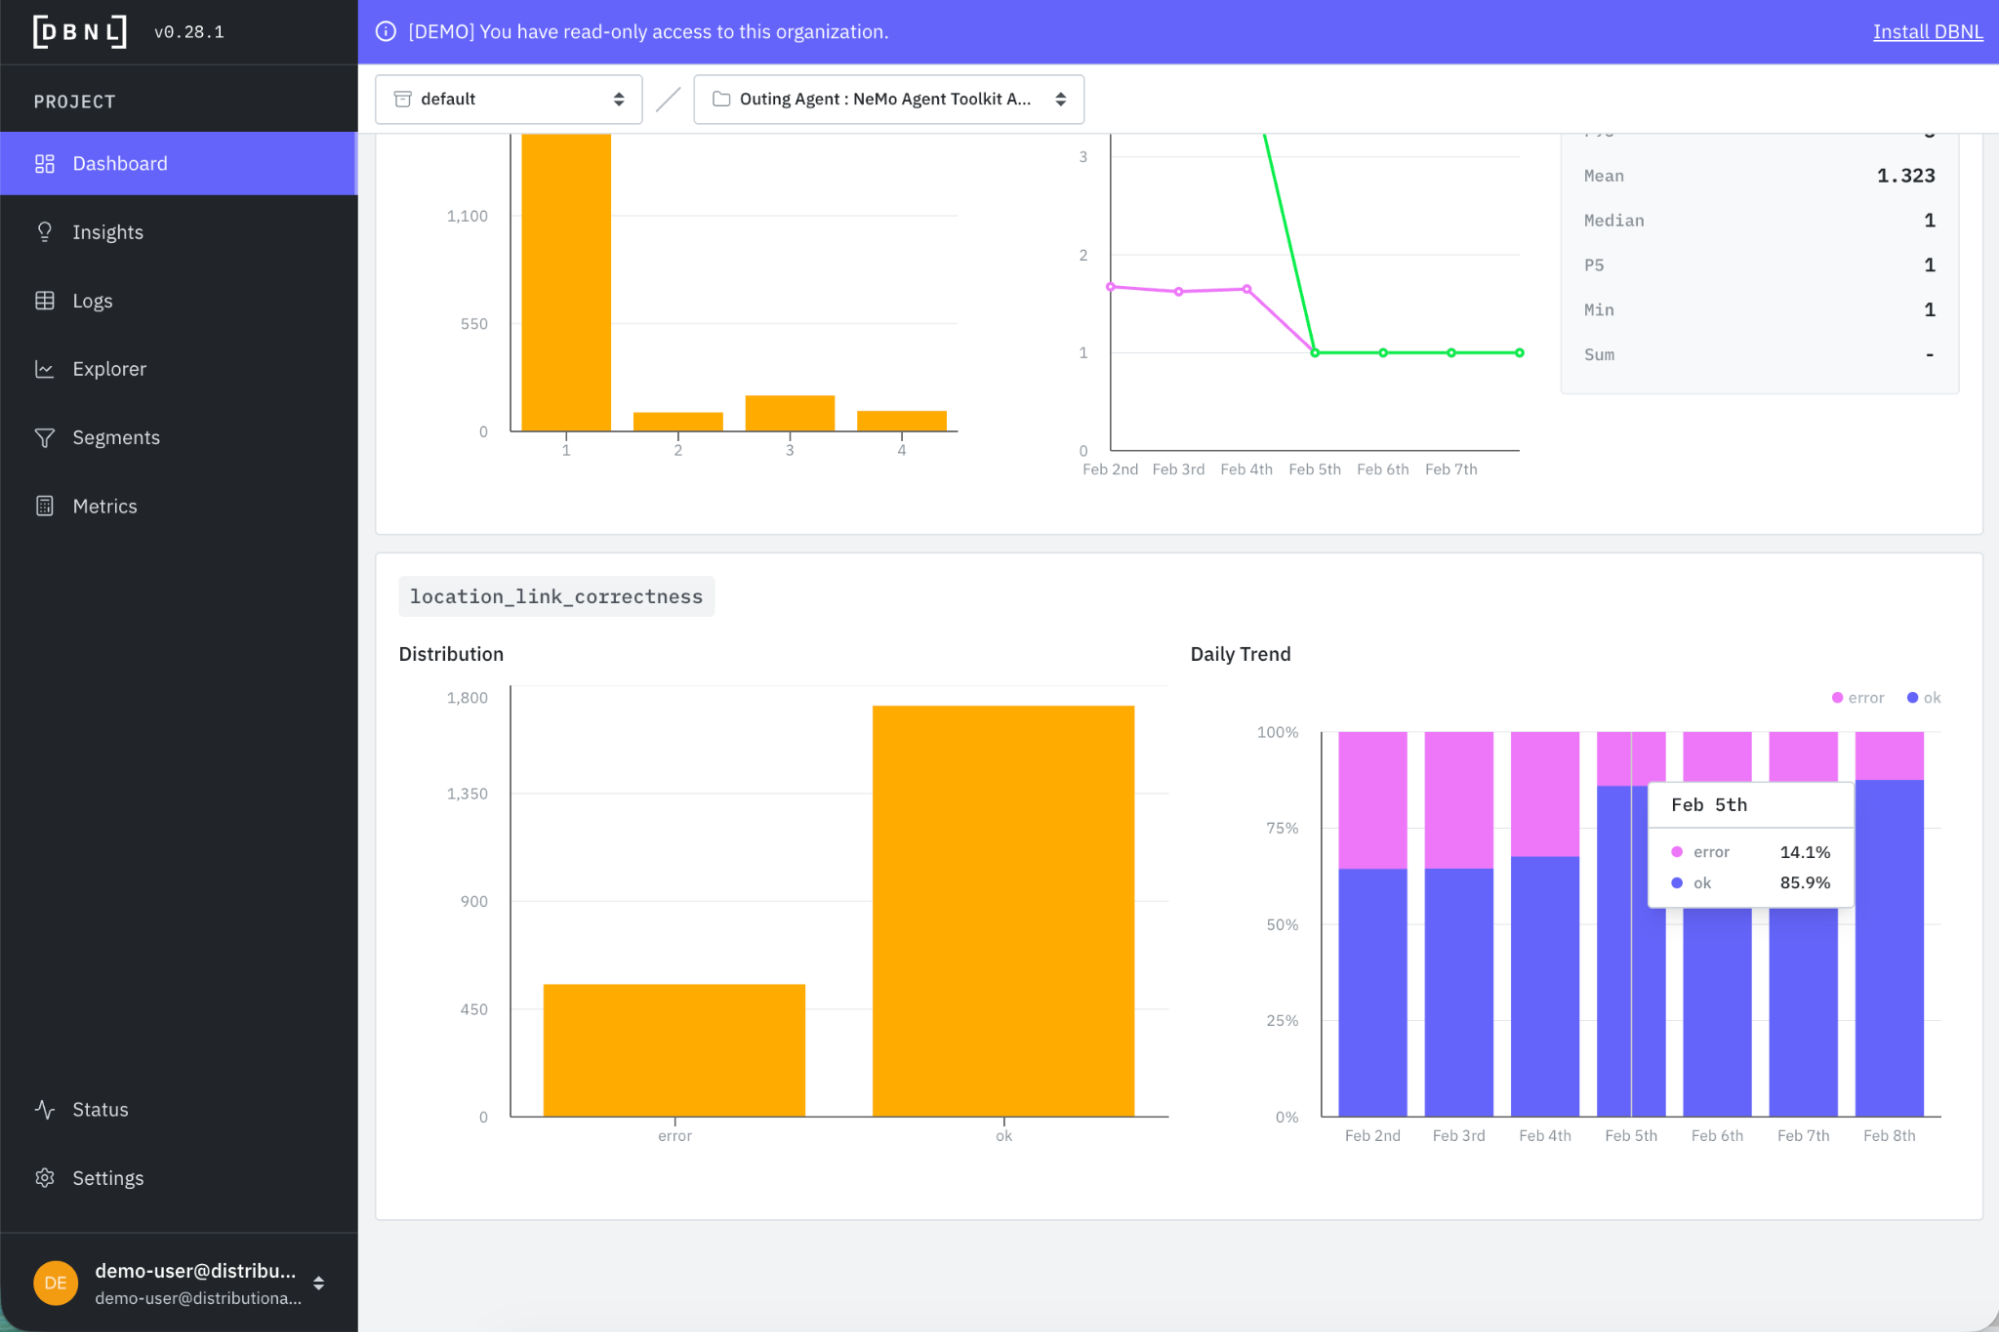
This metric is also valuable for confirming an improvement after a change has been made. In the Metrics tab of the DBNL Dashboard, you see the error rate for link correctness drop from 34% to 14% after we’ve selected the new prompt.
Even if you don’t create a custom metric, Distributional will show temporal change in the variety of behavioral metrics that should reflect this improvement as well. In this case, we see average feedback score jump from just over 2 to 4.5 after this change.
We also see output irrelevancy fall from 13% to 6% and average user frustration dip from 1.7 to 1.0 after the change.
Get started
This example shows how to take Distributional’s insights from analyzing production agent traces, and use them in an offline optimization workflow to tweak a prompt for immediate performance gains. Whether it is optimizing a prompt, hyperparameter, context, tools, or models with reinforcement learning, fine tuning, or re-training, Distributional can make this process a production data-driven feedback cycle.
The easiest way to get started is to use a free SaaS demo account to review this example and other examples that we’ve pre-loaded in Distributional. Next, you can install our sandbox locally on your laptop in ten minutes and run through a tutorial that shows you how to use Distributional for a toy example. Once more familiar with our functionality, you can install the full service for free using a Terraform Module or Helm Chart. We are happy to help through any step of this process, so reach out at support@distributional.com with any questions.
Subscribe to DBNL
Thank you for your submission!
Oops! Something went wrong while submitting the form.