Sometimes, simpler is better. In this demo, we simplify the example to show you more concisely how our product works.
We built a simple calculator agent built using Google Agent Development Kit (ADK) that calls a variety of tools (multiplication, addition, subtraction, etc) to answer math questions. We used a variety of data ingestion methods with this simple agent to show how you can use Distributional across diverse logging and tracing setups. And we introduced a couple simple issues to see if our analytics would automatically surface them. This example isn’t intended to mimic what you will be doing in the wild, but to give you a quick sense of the power of Distributional in the production agent stack.
To run this example locally using your own sandbox instance of DBNL, go to our Github tutorial: https://github.com/dbnlAI/examples/tree/main/adk_calculator_tutorial. In this tutorial, there is also a video walkthrough of the example if you’d rather follow along this way.
To explore this data using our read only SaaS demo environment, go to https://app.dbnl.com, use these credentials, and select the project “Google ADK Calculator Agent Tutorial”:
- Username:
demo-user@distributional.com - Password:
dbnldemo1!
Getting data into DBNL
One advantage of this simpler agent demo example is that we can also quickly showcase various ways to get data into Distributional. We’ve designed Distributional to be flexible, running almost like a plug-and-play compute engine regardless of how you collect or where you store your traces. For this example, we show multiple pathways you can use to get data into DBNL depending on your circumstances:
Circumstance and pathway
- Getting started: Agent=>OTEL=>Traces JSONL=>Augment=>SDK=>DBNL
- Ongoing production: Agent=>OTEL=>DBNL
- Existing ETL pipeline: Agent=>OTEL=>Raw JSONL=>SDK=>DBNL
- Traces stored already: Agent=>OTEL=>Langfuse=>Export File=>Augment=>SDK=>DBNL
Understanding agent behavior
We recommend you start by uploading a week’s worth of full session, trace, and span data to Distributional to get the richest insights. By analyzing this data, Distributional first helps you understand the status of the behavior of your users, your agent, and your outcomes in production.
This analysis includes a greater variety of cost, quality, and speed metrics you may find in LLM monitoring tools, including agent specific metrics around tool calls, tool error rates, tool sequences, user frustration, and response quality. But it also combines these metrics with product outcome metrics via downstream joins of these KPIs with your trace data. Further, it combines these metrics and KPIs with insights on user behavior, classifying their queries by topic. Finally, the analysis includes clustering and correlating across these metrics, KPIs, and usage patterns to give you a more complete picture of overall agent behavior.
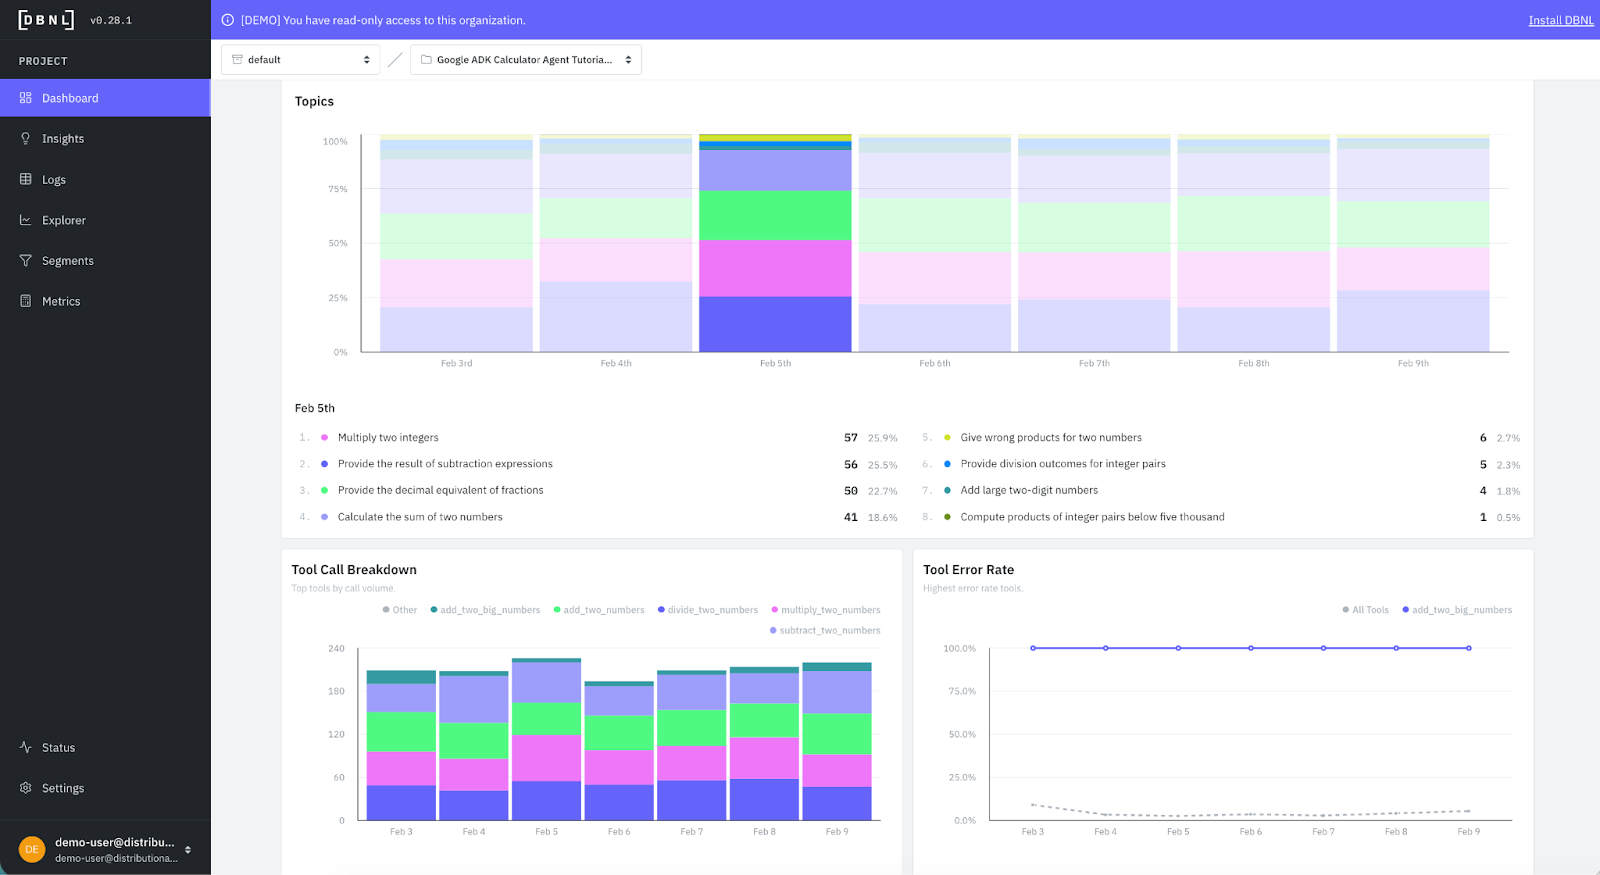
Here is an example of some of that richer information Distributional gives you on user intent and agent behavior from these calculator tool calls.
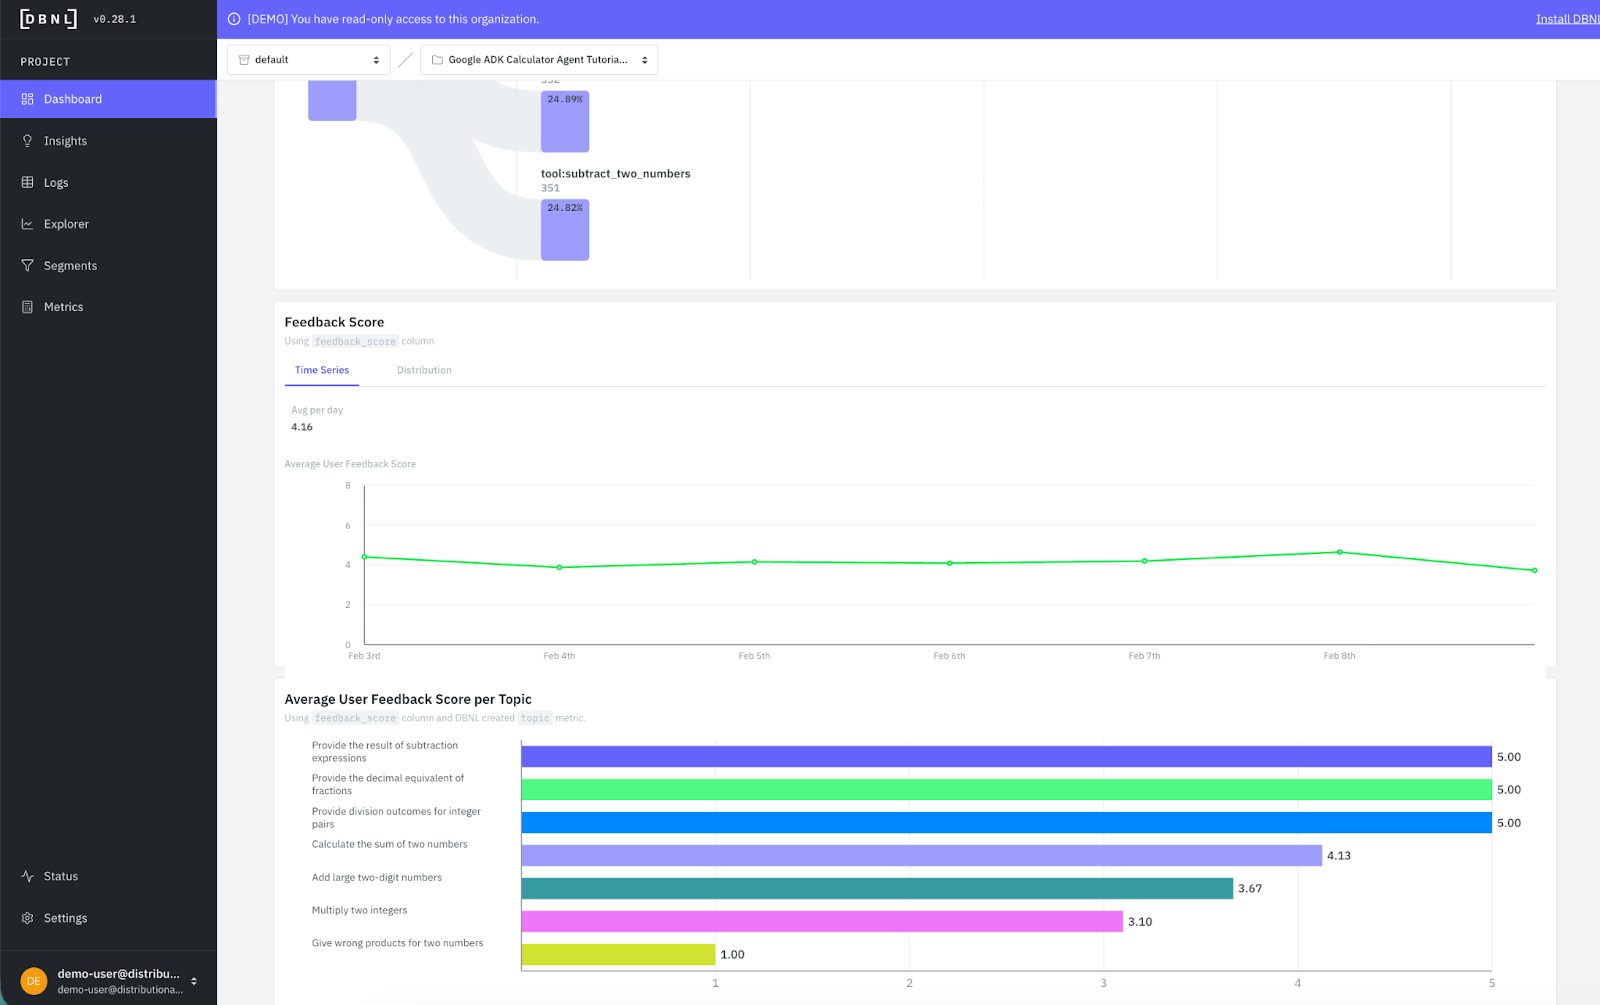
And here is an example where we bring in a downstream product KPI like user feedback and correlate it with topics to understand which topics are performing better or worse according to user feedback. We get a quick view that adding or multiplying two numbers may be an issue for this calculator.
Distributional also has an Explorer page that can be used to analyze single segments, compare multiple segments, or look at segment comparisons temporally. This page is useful for building intuition on metrics, segments, and behavior when you are getting started. And can offer an easy way to analyze a/b tests once you are further along, ensuring that any changes you make to your agents are performing as expected.
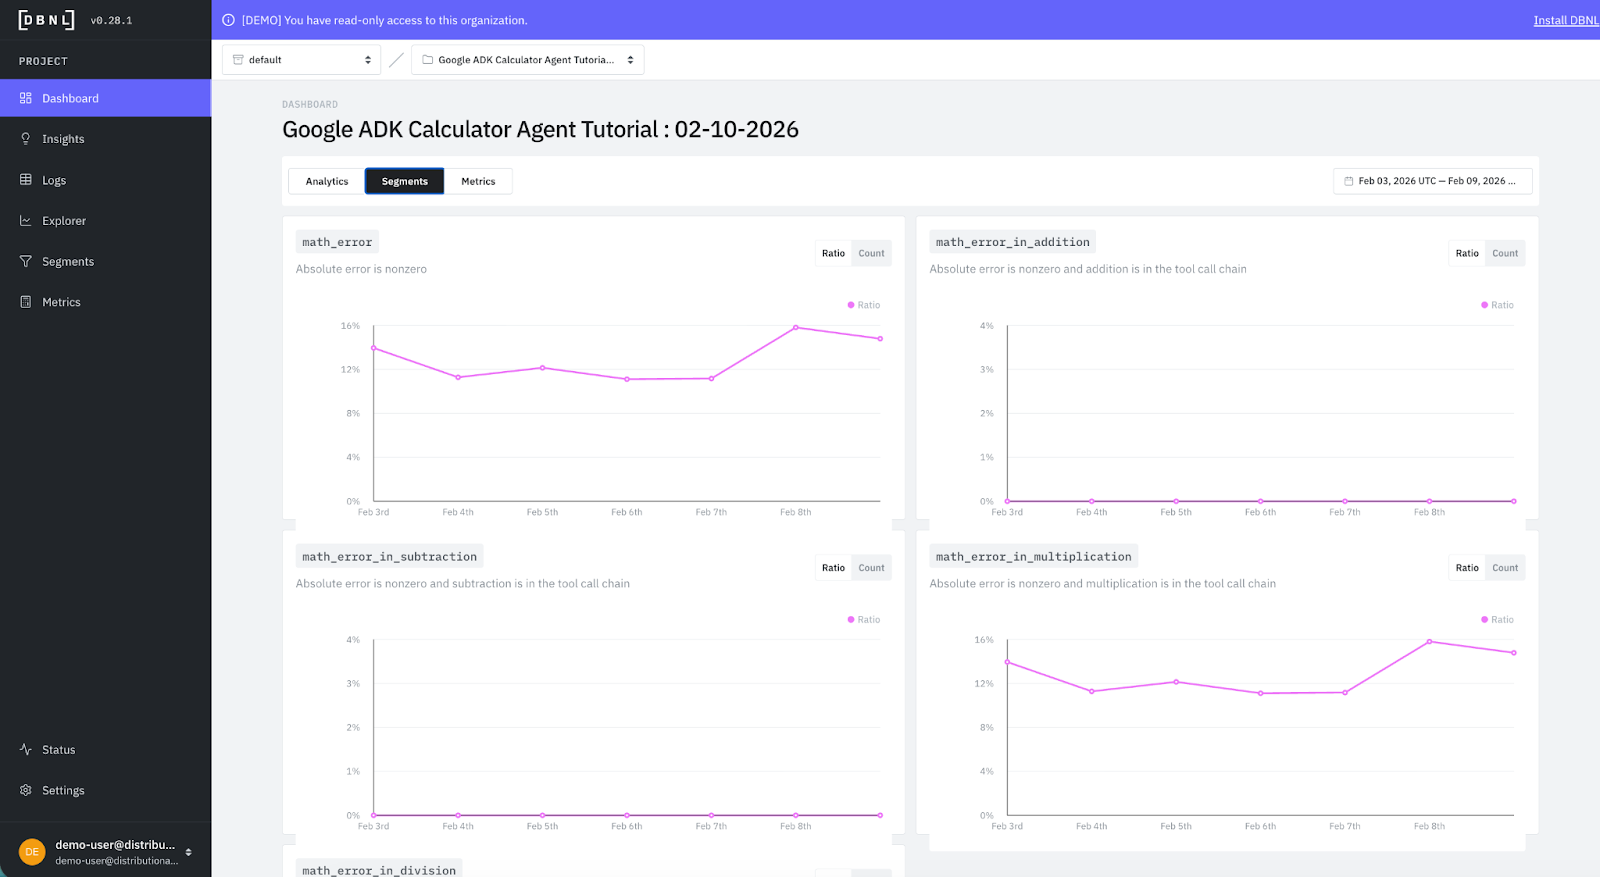
As you learn from the Explorer page, Distributional also makes it easy to create new metrics off of judge templates, or define new segments to track that reflect interesting clusters of usage or agent behavior. In this example, we’ve quickly added segments for various math operations so we can track error rates across them cleanly and get a quick visual on what is and isn’t working.
Fixing issues with insights and recommendations
Building on core understanding around agent behavior, one of the primary benefits of Distributional is that it surfaces new insights each day on the performance, behavior, cost, quality, speed, or usage of your agent, as well as the correlations across these attributes. This gives your AI product team a fresh set of potential issues or opportunities for improvement that can guide additional work on the agent to ensure you maintain high performance in production. And all of this happens automatically without taking valuable time from your team.
In this calculator example, we’ve intentionally introduced two issues so you can see how the product works:
- Trying to add any number larger than 90 will result in a tool error
- Multiplying numbers where the first number is less than 10 will cause an arithmetic miscalculation
Distributional Insights are designed to give you a toehold into understanding these issues, and a starting point for how to resolve them with tailored recommendations.
Here is an example of a single day of insights from running this calculator. Distributional has generated each of these insights automatically, and classified them by KPI (quality, speed, cost), type (error, issue, change) and severity (high, medium, low).
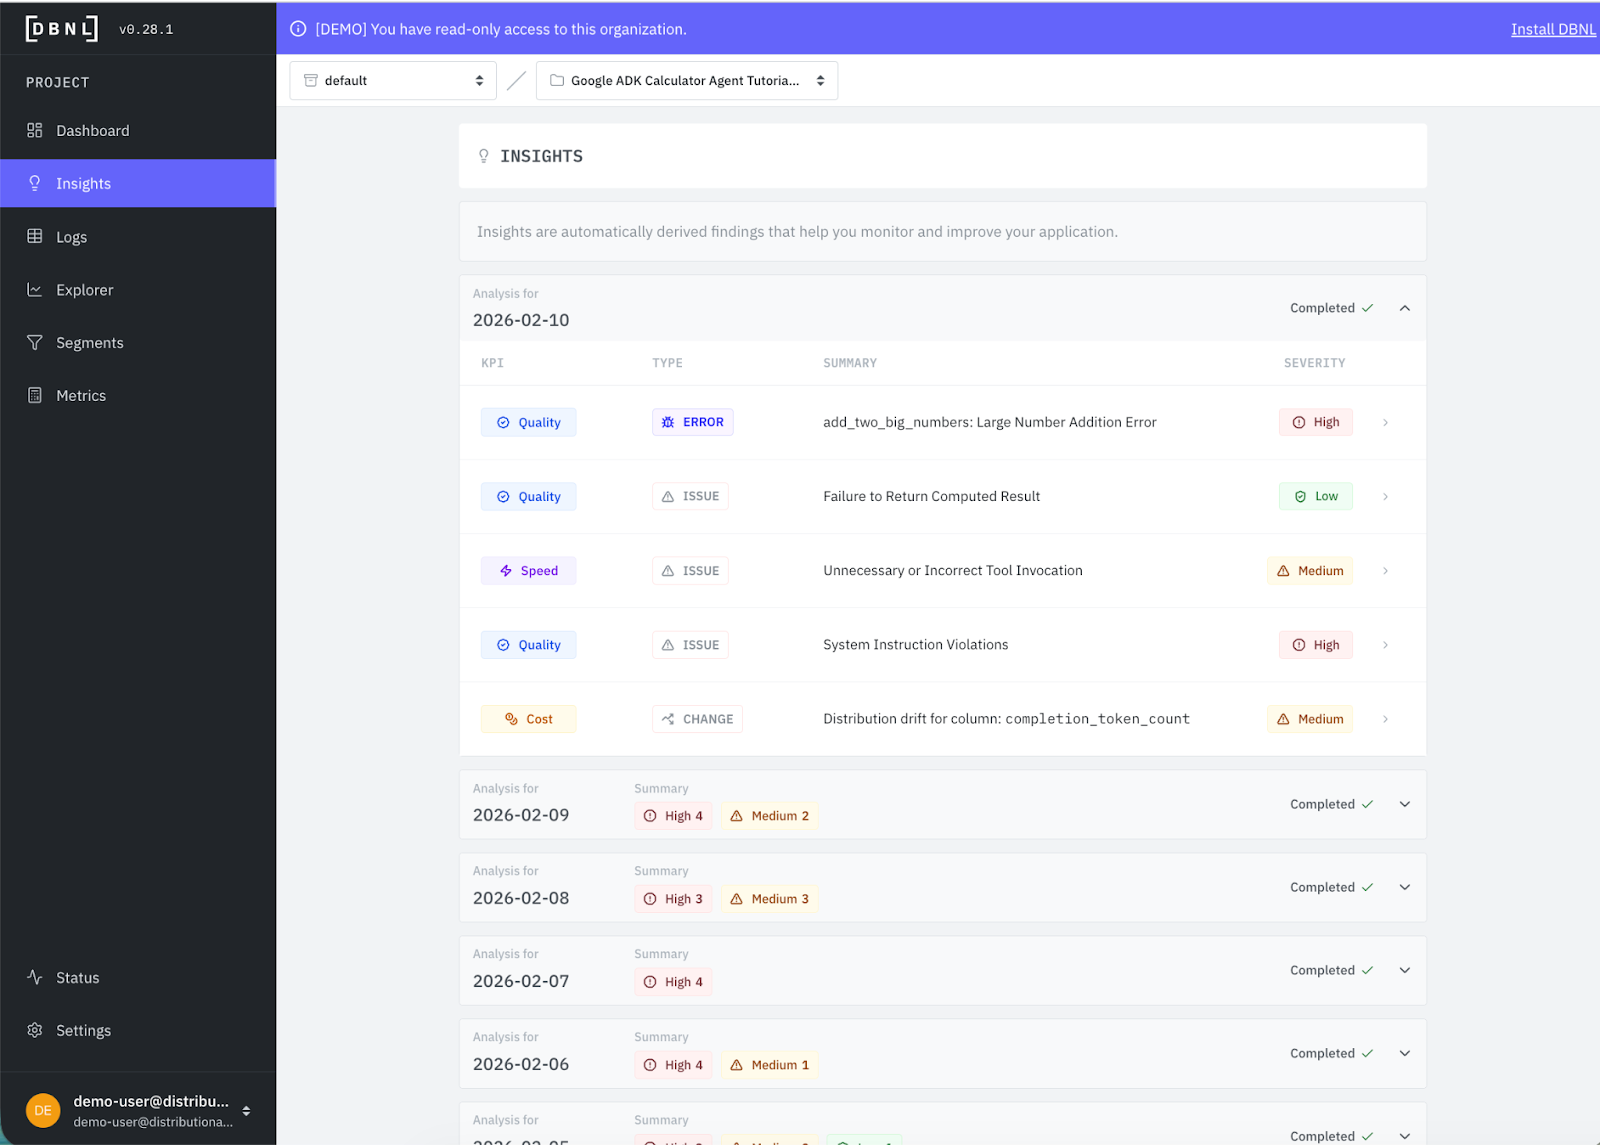
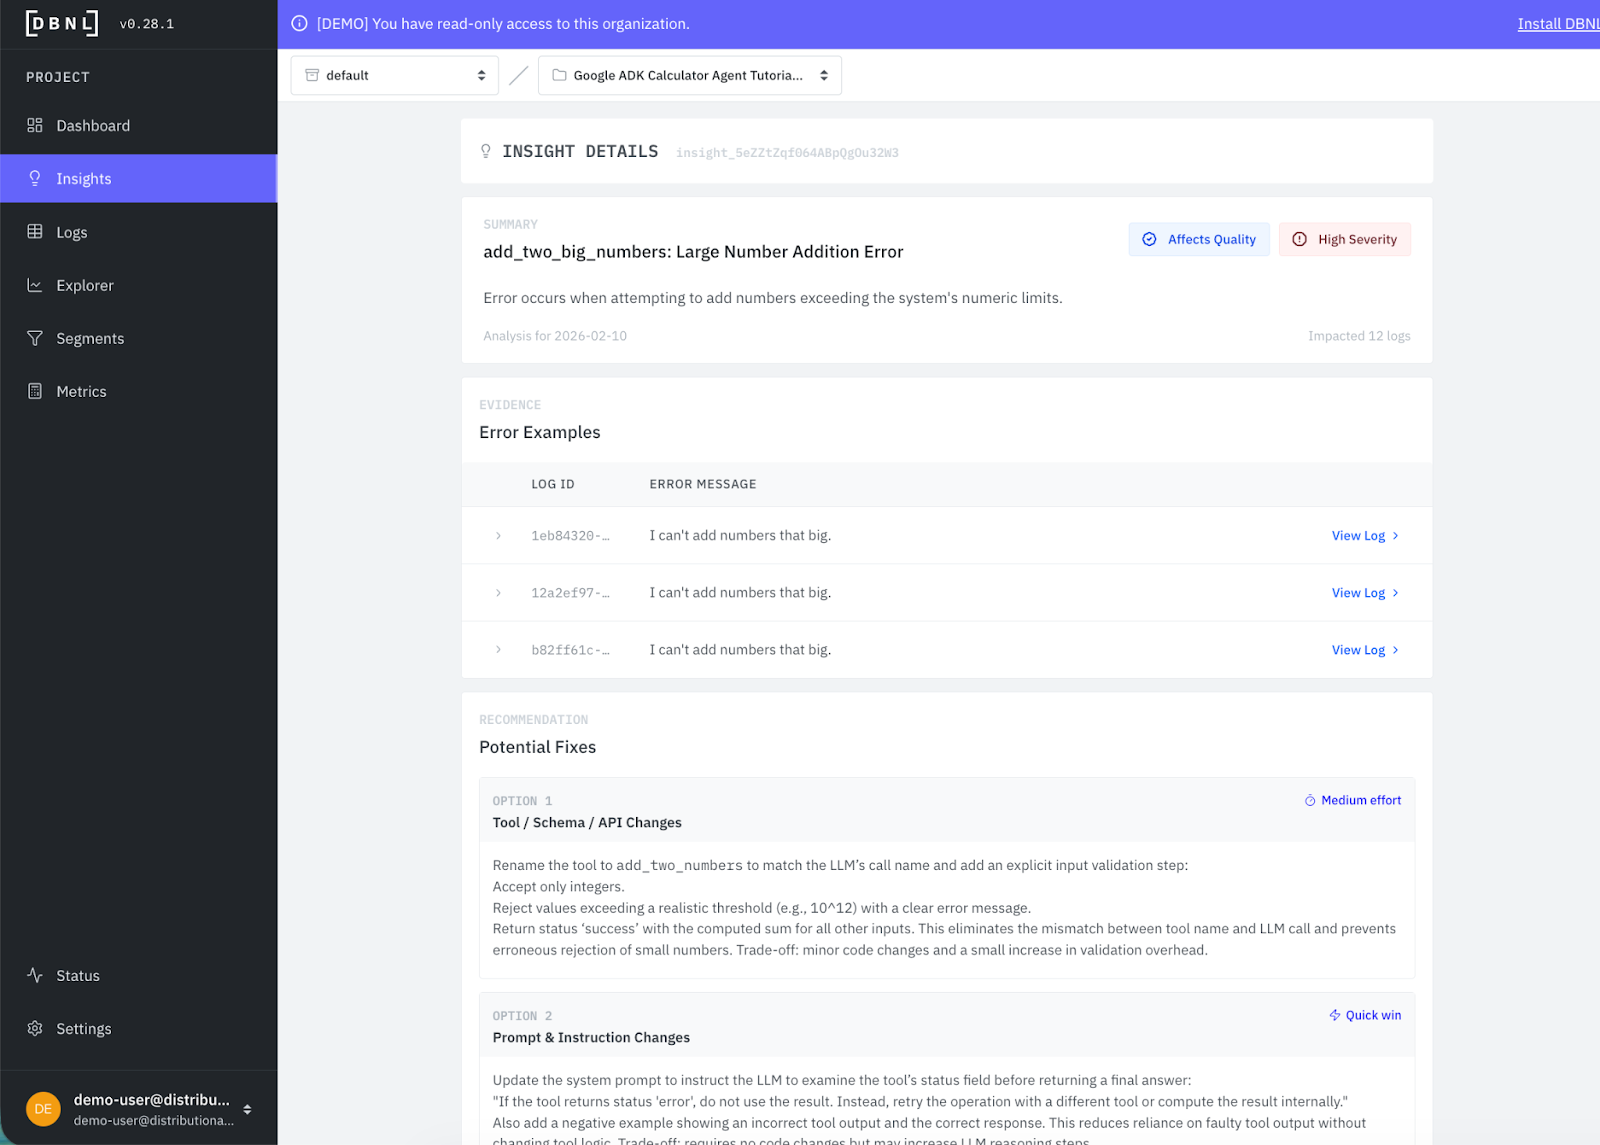
This makes triage easy, as you typically will want to start with the high severity issue, which is also the first insight listed. You can immediately get a sense of what the issue is from the summary. Then by clicking in, you get more rich information, including a description of the issue, example logs to explore as evidence, and recommendations for how to fix it. We also offer single-click segment creation to easily track this issue over time.
In this case, the calculator is failing to add two large numbers, and Distributional has recommended a tool change, prompt change, or guardrail you can implement to address the issue with an assessment of whether the engineering level of effort to accomplish the task.
The goal of this approach is to get your team in a virtuous feedback cycle. Users prompt your agent, you collect these traces, Distributional gives you daily insights on what to fix or improve, you implement the change, and you see the performance gains in Distributional over time.
Get started
The easiest way to get started is to use a free SaaS demo account to review this example and other examples that we’ve pre-loaded in Distributional. Next, you can install our sandbox locally on your laptop in ten minutes and run through a tutorial that shows you how to use Distributional for a toy example. Once more familiar with our functionality, you can install the full service for free using a Terraform Module or Helm Chart. We are happy to help through any step of this process, so reach out at support@distributional.com with any questions.
Subscribe to DBNL
Thank you for your submission!
Oops! Something went wrong while submitting the form.