
I often get asked some variation of the questions, “What standard evals do you offer in your product?” Or “How does this compare to evals tooling?” My answer often starts with reframing what we do from evals to enrichments. So what do I mean by this?
This post was heavily inspired by a conversation between Scott Clark, Distributional co-founder and CEO, and Jason Liu of the Developer Experience team at OpenAI. You can watch this here (especially minutes 20-35):
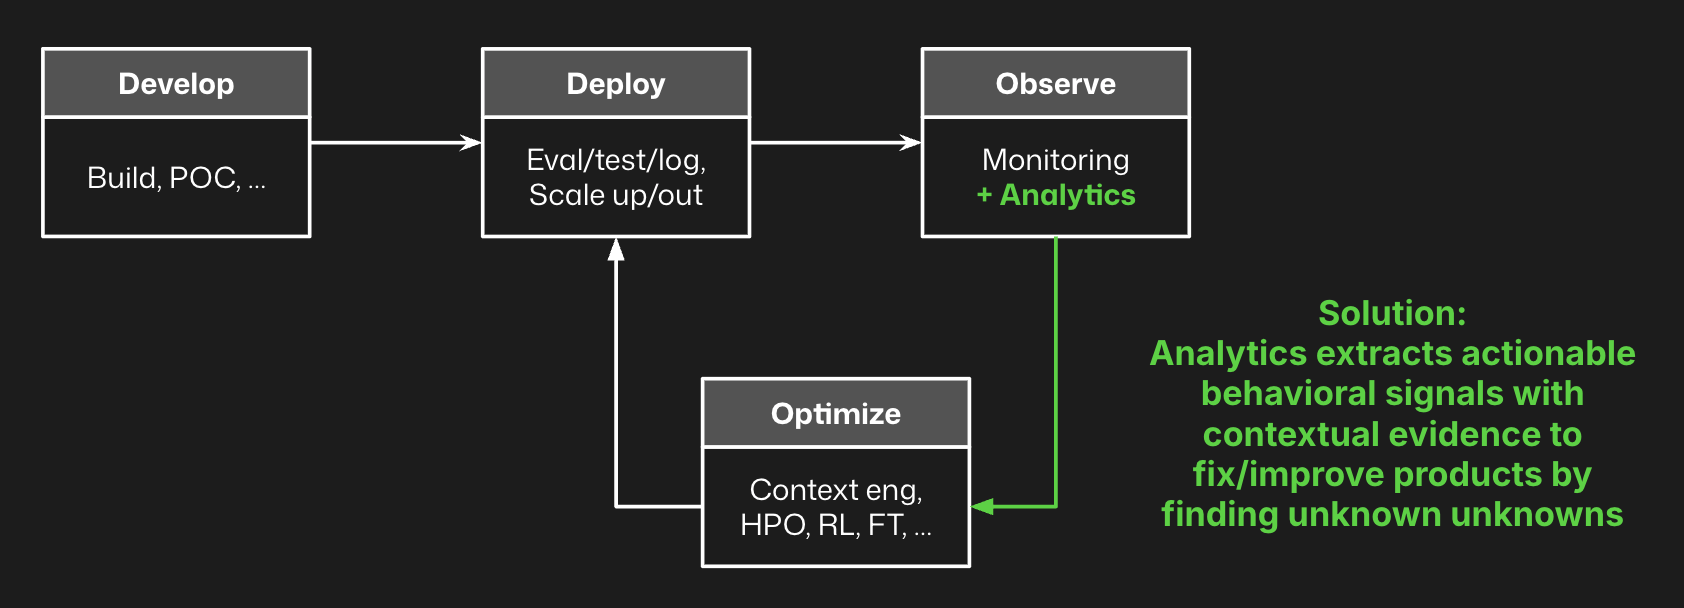
How evals fit with analytics
The purpose of evals is to closely represent as narrowly defined criteria for success or performance as possible in an offline testing scenario. Fewer, specific, heavily scoped metrics is the objective, so you have a way to understand agent behavior on known knowns. The goal is to use these evals to optimize performance.
The purpose of analytics is to find otherwise hidden signals in your production agent logs. More, general specific, scalable metrics are the objective, so you have a way to identify unknown unknown and known unknown signals. The goal is to use analytics to identify opportunities to optimize performance with evals and other techniques. Instead of trying to come up with an eval that perfectly encapsulates quality, we use a wide range of weaker signals to find the interesting correlations that suggest unknown issues or opportunities.
Philosophically, the idea behind analytics is that it is impossible to identify all the potential emergent behaviors from your agent pre-production. The only way to understand all the permutations of user, usage, agent response, and all of the context within this process is to observe what happens in production.
AI product teams use analytics to identify clusters, correlations, patterns, or other interesting insights on agent behavior, and then develop evals off of these insights. Whenever they create a new eval, they add that to the combination of metrics that are assessed by the analytics solution, building richer and richer data for this analysis over time.
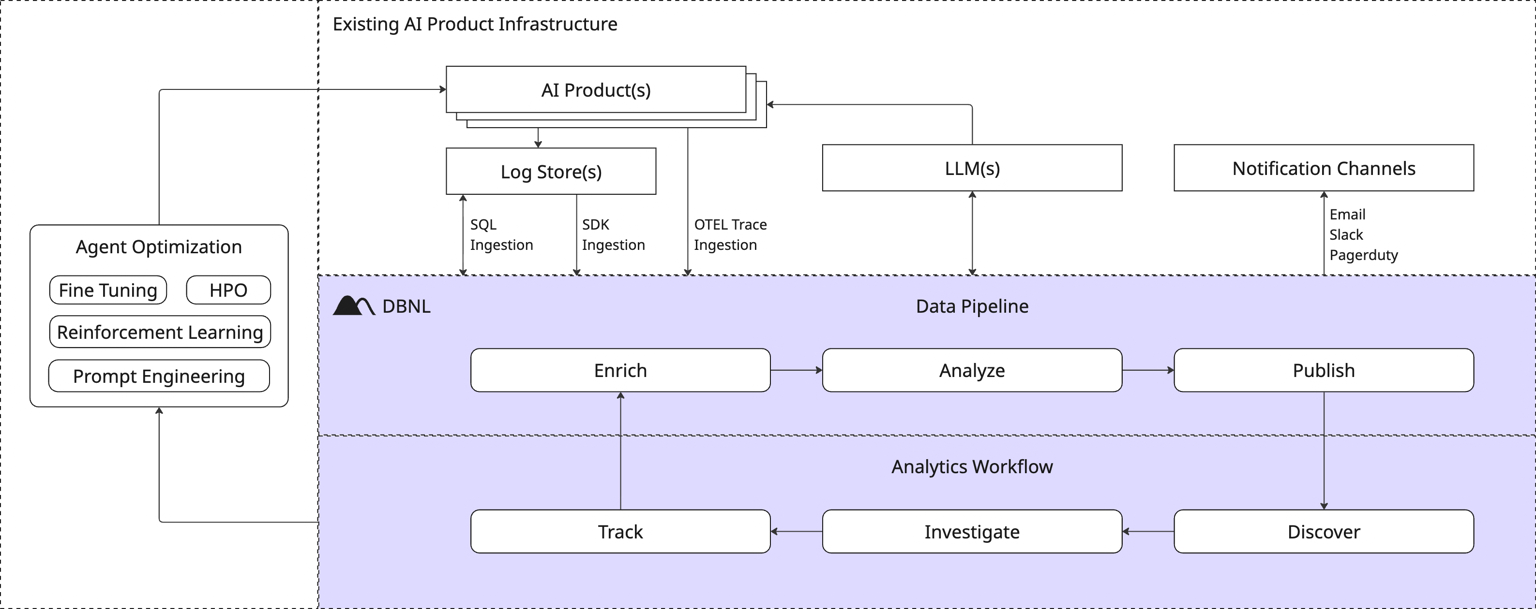
Enrichments that power analytics
We use the term enrichment, because the goal is to enrich your traces with attributes that represent various aspects of agent behavior – behavioral vectors to analyze.
If you only have inputs and outputs, you can get some signal from analytics. If you add richer multi-level tracing data – sessions, traces, spans – you get more interesting insights from analytics. If you join these traces with downstream KPIs or session-level events, you get even better insights from analytics. And if you add your own specific evals to the collection of metrics, you get an even stronger signal from analytics. Analytics is enhanced when you can look at the full distribution of all of these behavioral vectors in a high dimensional space, and then pull out the most interesting signal.
For context, Distributional offers out of the box a variety of LLM as judge metrics and traditional natural language processing metrics to get you started. But we also make it easy to design new metrics and join traces with downstream product KPIs so you can enhance these enrichments to produce more robust analytics.
Towards “tab complete” analytics
We do these enrichments to build a bigger haystack so analytics can do the job of finding the needles in this haystack – signals to understand, fix, and improve production agents. The goal is akin to “tab complete analytics” where instead of spending a week doing data science yourself, insights are proactively presented to you and you can quickly triage – “I care about this, let’s track it. I don’t know what this is, I’ll quickly investigate. I don’t care about this, I’ll ignore it.” The goal is to continually find and fix new issues over time to boost agent performance.
We facilitate these “tab complete” analytics by performing unsupervised learning and clustering on these enrichments at scale, pulling out sub-pockets of these behavioral vector distributions, and prioritizing insights that showcase situations where something didn’t happen very frequently or where a behavior is correlated with a cost, speed, or quality issue that requires attention. These clusters are different than anomalies, because sub-peaks within a multimodal distribution are also potentially relevant, not just the peaks. And agents are incredibly multimodal. We feed these clusters into an LLM – it can be on the smaller end, some of the best we’ve seen are 70b parameter LLMs – to summarize the issue and recommend fixes.
These analytics are relatively cheap to compute, and the goal is to engage with them to refine the enrichments and analysis over time. As you improve and fix your agent, these insights will adapt to find new signals that need your attention, and around you’ll go on this flywheel.
Next
Before founding Distributional, we spent years together focused on Bayesian optimization for hyperparameter optimization and other offline experimentation tasks when training traditional AI/ML models at a startup called SigOpt that we sold to Intel in 2020. We worked with American Express, Netflix, OpenAI, $1T worth of hedge funds, and many others operating at the extreme end of scale and performance for these systems. In all cases, when they started optimizing, they’d find they had new issues they had to account for in their objective function. The way we’ve designed this version of analytics for production agents is to enable you to continuously refine this objective function – a continuous behavioral space – so you can properly optimize agents across all attributes and guide their behavior over time. You optimize what you measure, but you only measure what you know.
Distributional is a free, open, and installable platform for agent analytics. Try it today and quickly learn how it complements your existing agent observability stack. We are also always happy to learn more about your use case and enterprise needs, so reach out to contact@distributional.com with any questions.
Subscribe to DBNL
Thank you for your submission!
Oops! Something went wrong while submitting the form.