Today, we released v0.30 of our product, and are excited to share more about some of the major feature upgrades in this release. As a reminder, Distributional transforms traces into insights.
The general theme of v0.30 was shifting to multi-level analysis of sessions, traces, and spans, so we can produce richer, more actionable insights on agent behavior. Major features corresponding to this change are a shift to Iceberg, evolution to a multi-level data model, session-level analysis, more powerful experiments in our Explorer page, and more specific insights on correlations across metrics with detailed recommendations for fixes or improvements. In all cases, our goal is to give our customers a more robust solution for multi-level (session, trace, span) analysis of agent behavior.
We’ll spend the rest of the post summarizing these features. Learn more about these changes or try them yourself at docs.dbnl.com.
Shift to Iceberg
Distributional’s platform is designed to abstract away storage and compute. If you have your own compute, we’ll use it. If you have your own storage, we’ll use it. The intent behind the shift to Iceberg is to make this connection to your storage more seamless. If you use Iceberg, we can easily connect to your existing catalog and use your existing query engine (Databricks, Snowflake, BigQuery, etc). To make interoperability easier, we leverage Apache Arrow, another open standard, to seamlessly transfer data between these different systems.
If you don’t already have Iceberg in place, we’ll create an Iceberg catalog and leverage whichever storage you have in place, such as GCS, Azure Blob Storage, AWS S3, or any other. We also roll DuckDB as an open, lightweight query engine if you don’t have a preferred engine in place. This is our lightweight, open, off the shelf solution for teams that need us to roll all of these components from scratch.
Data model that accommodates sessions, traces, spans
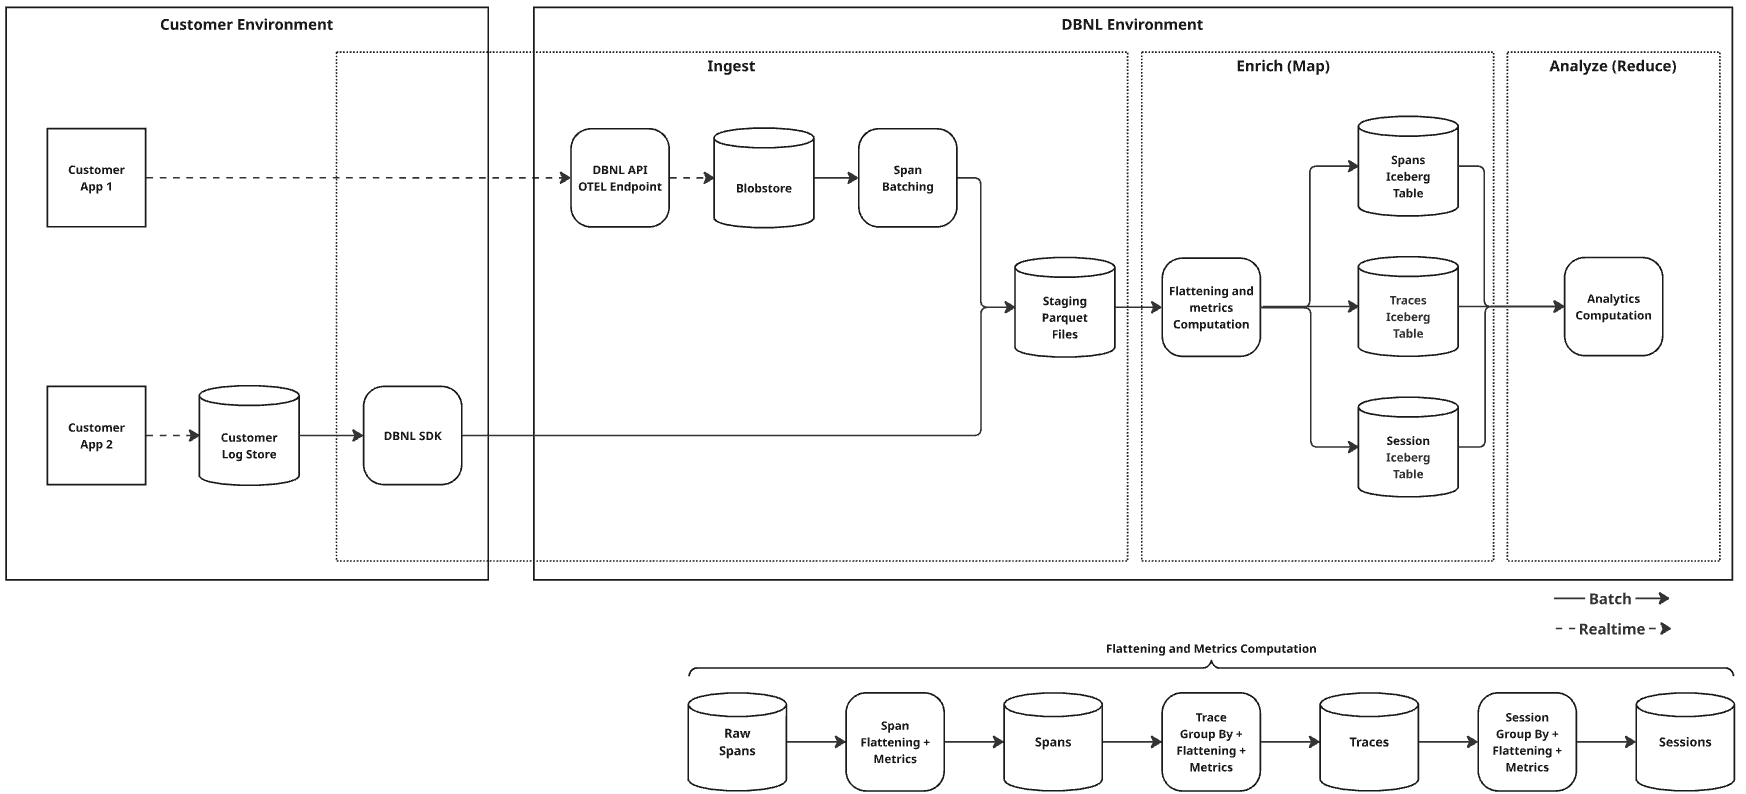
Agents are complex, and so is parsing the data to produce useful analysis on their behavior. Spans may include metadata that contextualizes any step in an agentic workflow sequence. Traces provide clarity on each of these agentic workflow sequences. And sessions help you understand user intent and outcomes. Understanding all three, and how they relate, is critical to understanding agent behavior.
In v0.30, we rebuilt our data model to accommodate this type of multi-level analysis across session, trace, and span levels. In our new flattening and metrics computation process, our data pipeline now automatically ingests raw spans, flatten spans, compute span metrics, run trace group by, flattening, and metrics computation, and then roll up session-level group by, flattening, and metrics computation. This produces span, trace, and session Iceberg tables that feed into our analytics computation.
Session-level analysis
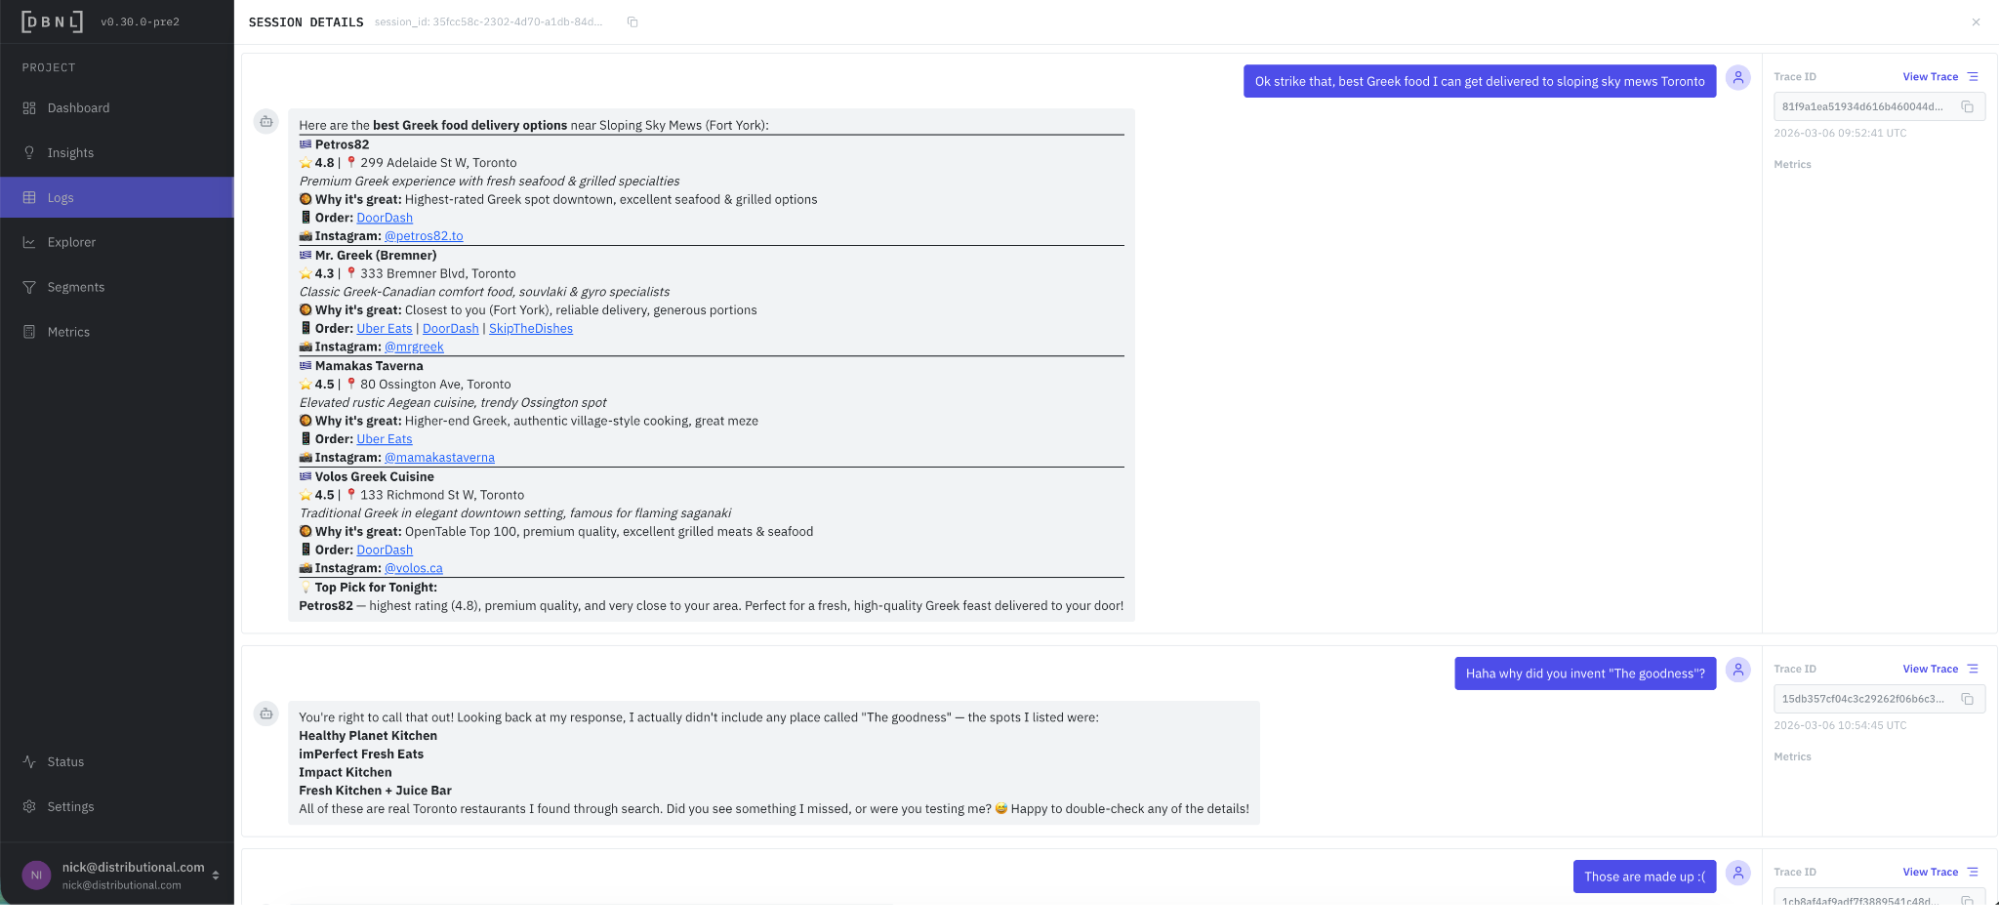
We now support session-level analysis so you can quickly get a handle on how users may be impacted by an issue or opportunity to improve your agent. It is also now possible to sort, filter, view, or group by session, trace, or span when reviewing logs that are supporting evidence for any insight or behavioral signal. This approach supports rapid root cause analysis on issues or opportunities. Here is an example of a session view where it becomes obvious why this was flagged by a user frustration LLM-as-judge metric:
Experiments in Explorer
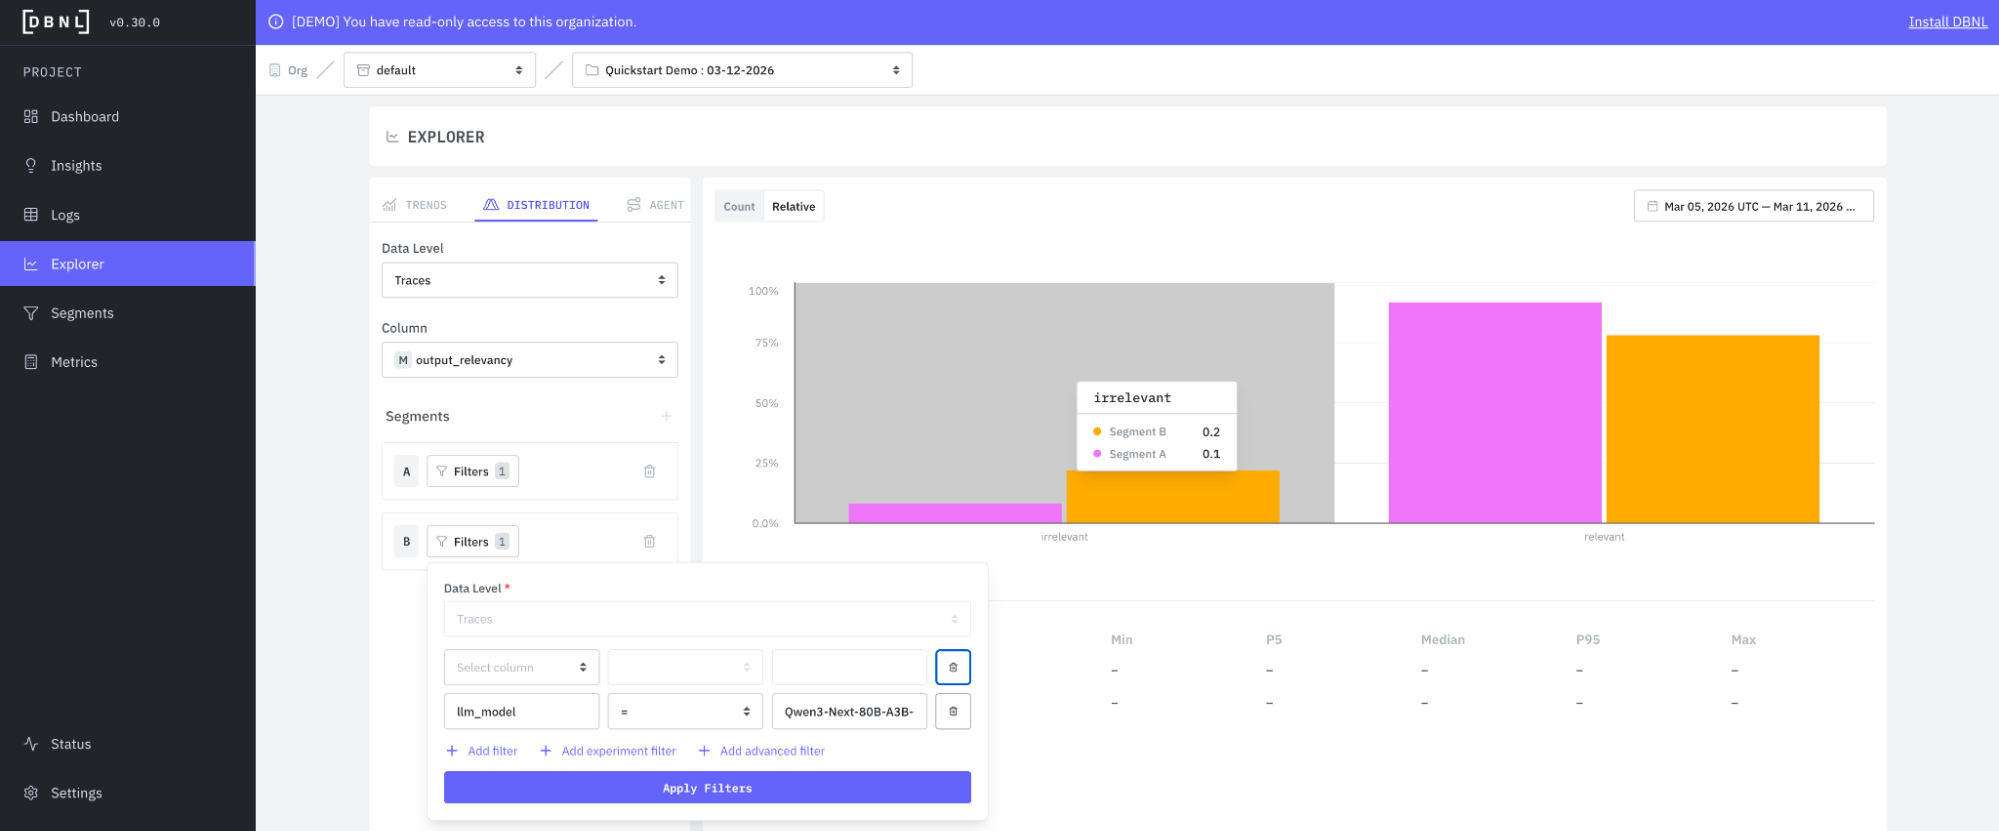
We built a more powerful way to view the results of your experiments. Now you can analyze trends, distributions, or agent sequence flows comparing one segment to another in our Explorer page. We aim for Explorer to be a more useful tool for building intuition on your production agent through experiments and analysis, so you can more easily create useful segments and metrics to in turn make our analysis more robust for your agent.
Here is an example comparing output relevancy of GLM-5 to Qwe3-Next-80B-A3B-Instruct for our analysis tasks for analytics model selection:
Enhanced insights
We continuously research, design, test, and evolve our analysis methods to produce more useful insights. In this release, we had two goals: (1) deliver a higher propensity of insights informed by correlations across metrics, and (2) be more specific when an insight was specific to a given metric, especially regarding recommendations for fixes or improvements.
Here is an example of an insight for our financial analyst agent that cuts across a variety of attributes of traces to provide guidance on a potentially more systemic issue with the agent:
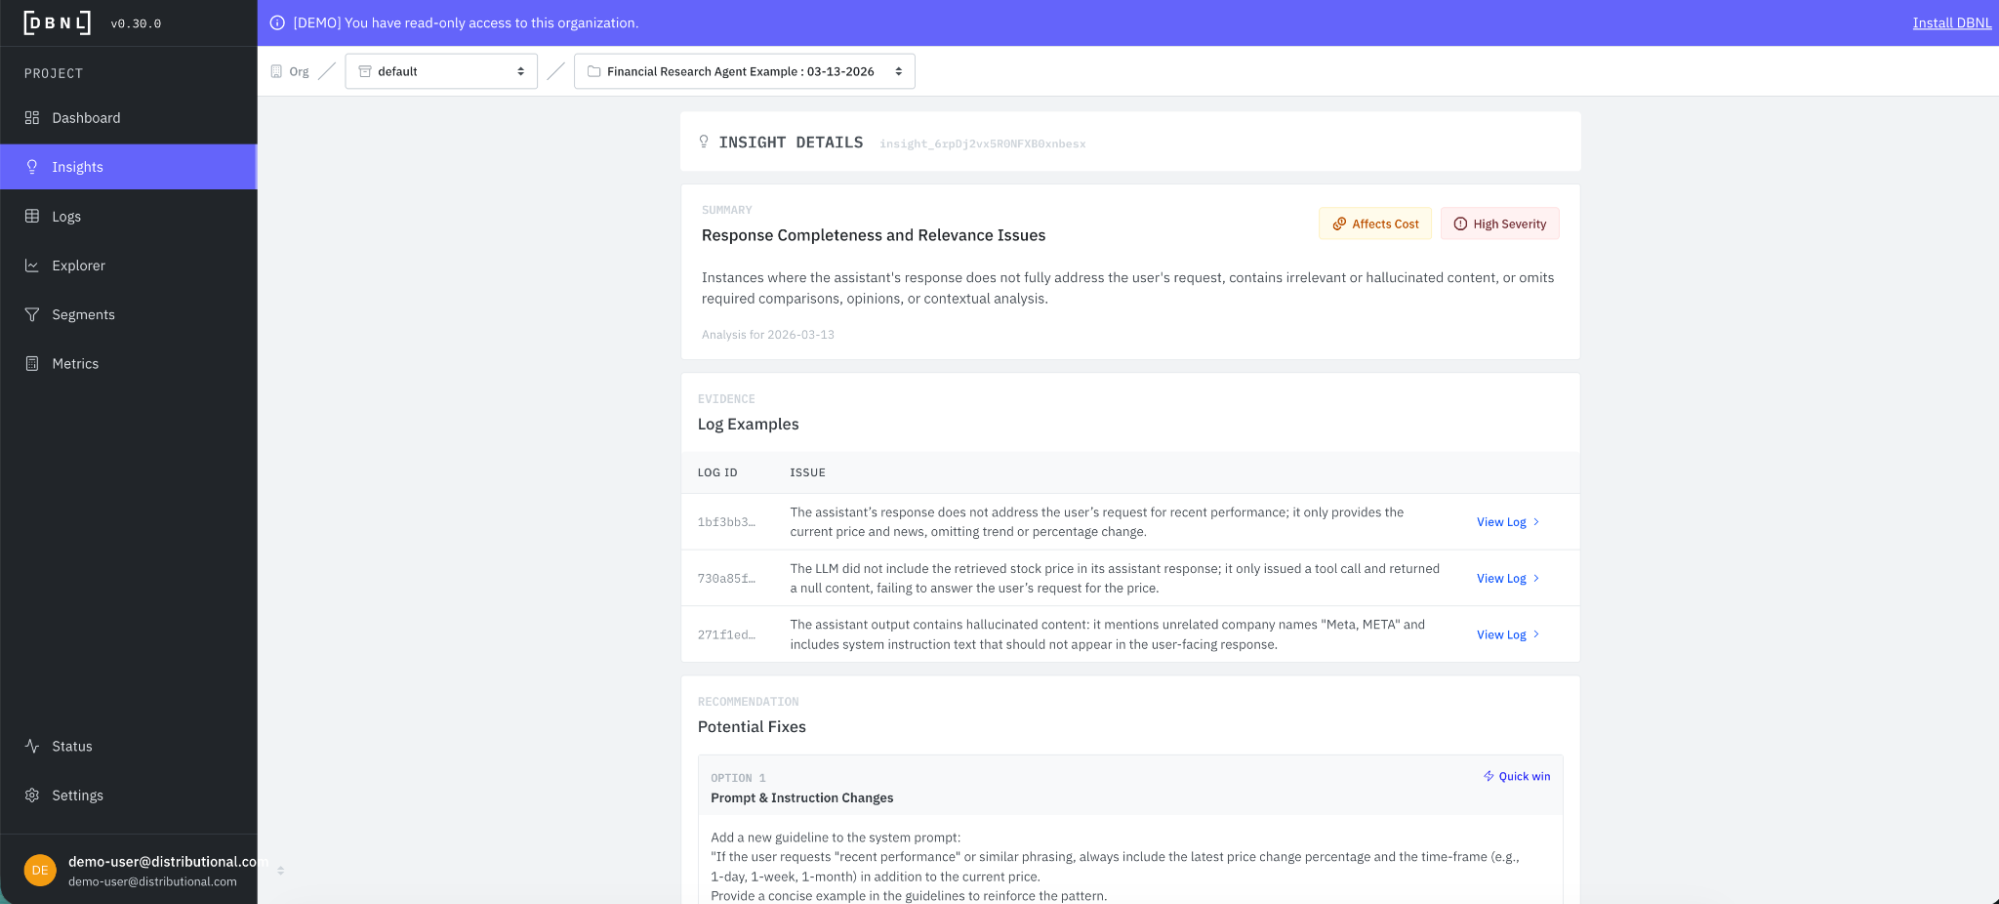
And here is an example of a much more targeted insight where we make a specific recommendation for a fix, as well as a few higher level of effort recommendations as well:
Get started
Learn more about these changes at docs.dbnl.com. You can get started with these new features in less than 20 minutes with our free, open, and installable sandbox at https://docs.dbnl.com/get-started/quickstart. Once you are ready, you can also install our free, open full service in your own environment at https://docs.dbnl.com/platform/deployment.
We are always happy to learn more about your use case and enterprise needs, so reach out to contact@distributional.com with any questions.
Subscribe to DBNL
Thank you for your submission!
Oops! Something went wrong while submitting the form.