Distributional is an adaptive testing solution for enterprise AI applications, built to help teams define, detect, understand, and improve upon an application’s desired behavior. To enable this, Distributional’s user experience was designed to translate the complexity of GenAI application logs and traces into coherent insights, giving teams rich information to act on. By providing several opportunities to customize the experience, Distributional can be tailored to an individual team or app’s specific needs.
In this article, we’ll review an example of a customer support agent use case to showcase how the product works, and map it to the four-stage Distributional workflow: Define, Detect, Understand, and Improve. To learn more, download the paper on Distributional’s User Experience.
The Distributional workflow
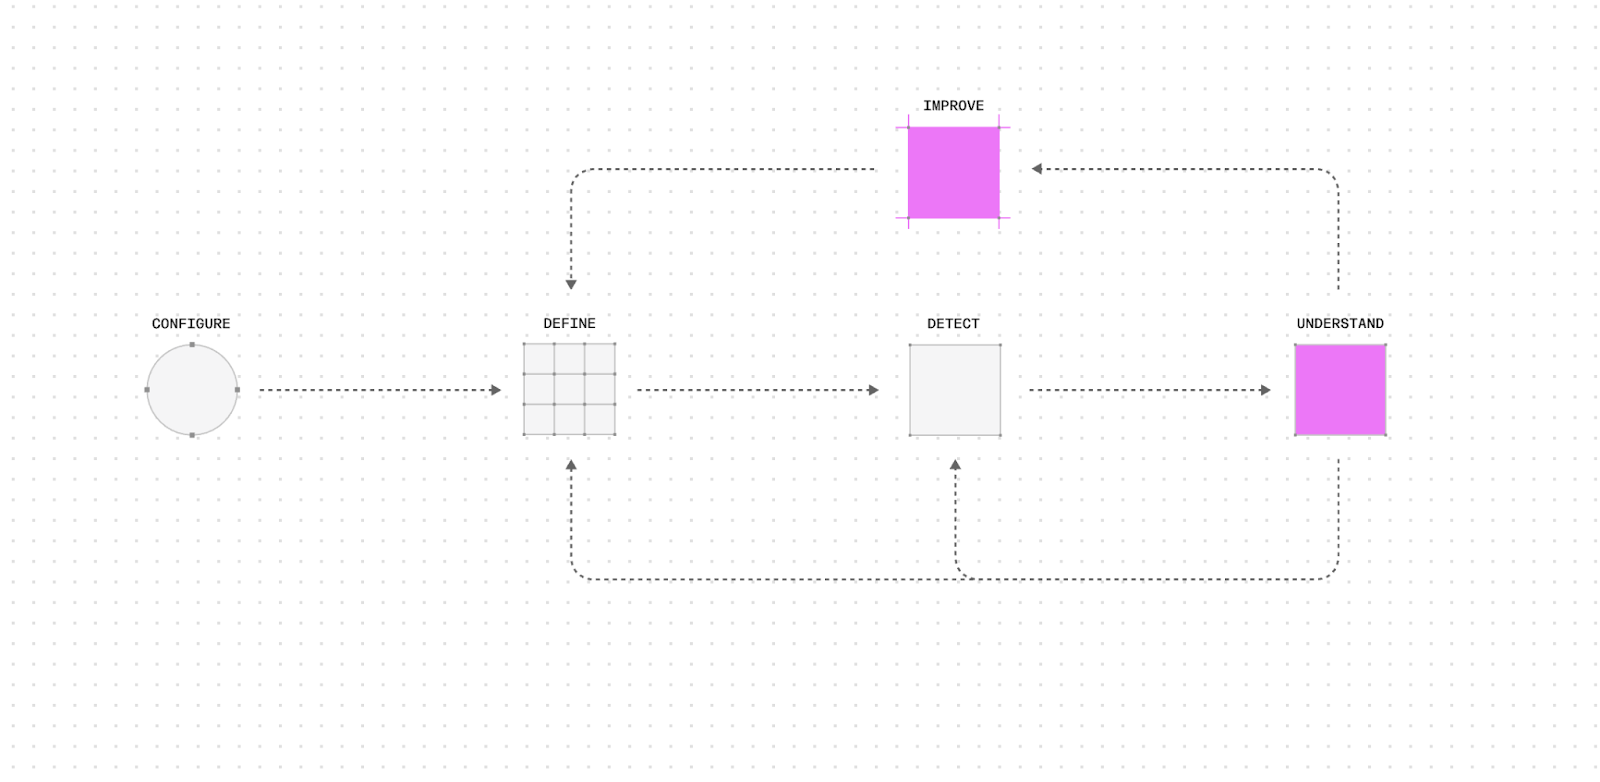
There are four steps in the Distributional workflow:
- Define the behavior or status of your AI application
- Detect changes in this behavior over time
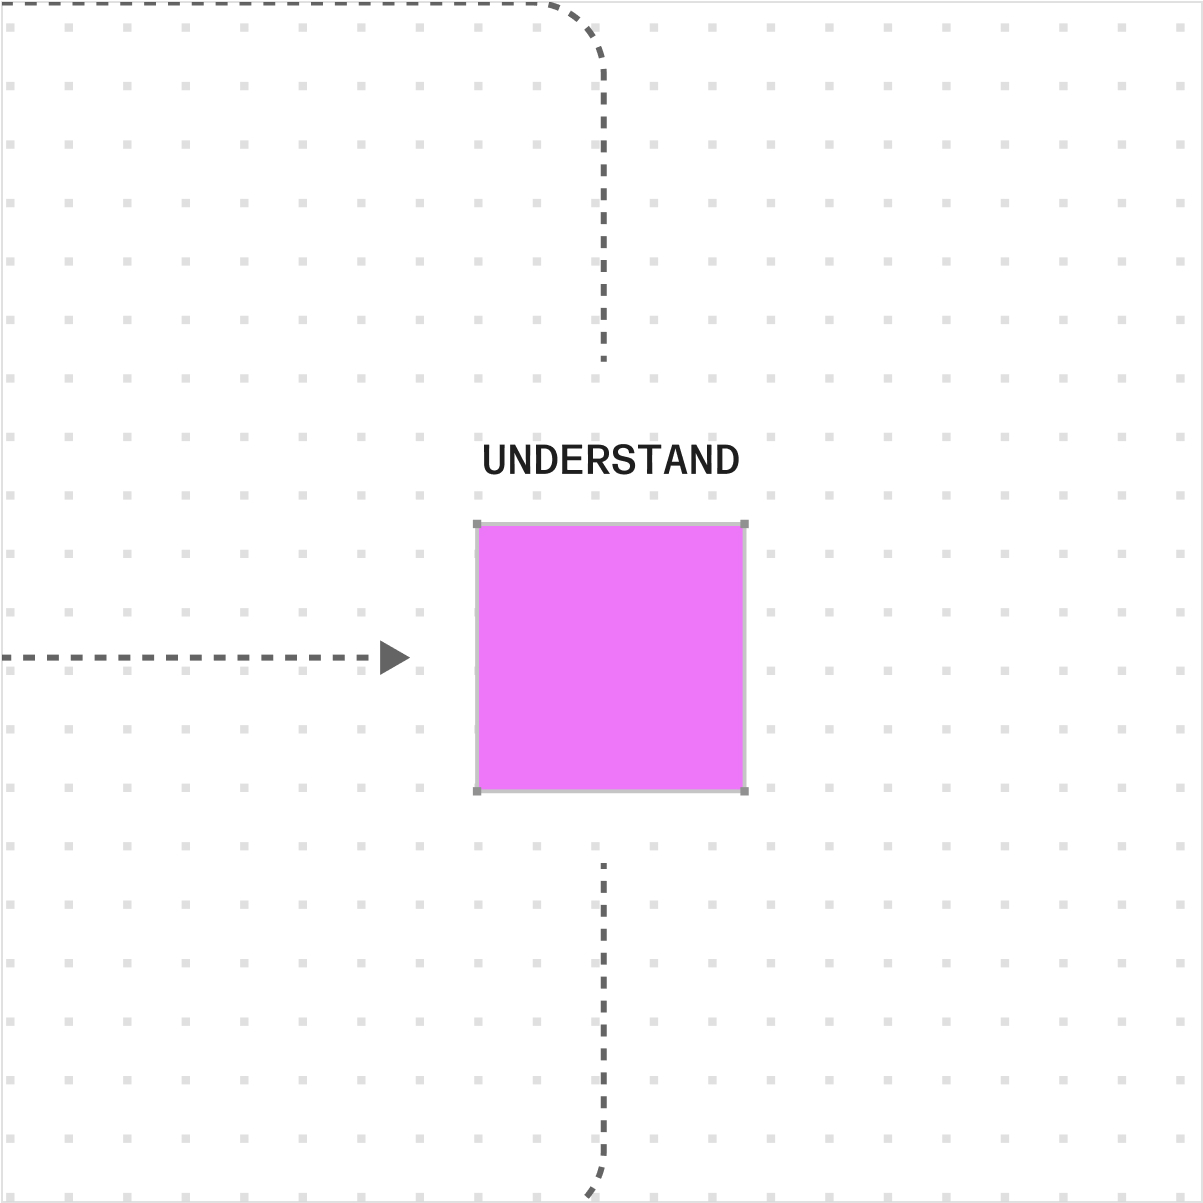
- Understand what caused this change and whether you care
- Improve measurement of AI application behavior to align it with your business goals
The expectation is that AI product and engineering teams iterate through these steps on a regular basis as their AI application evolves in production. As they iterate through these steps, they refine and improve their definition of AI application behavior, leading to even richer insights in the future. This virtuous cycle of continuous AI product improvement is designed to help teams keep up with fast-paced AI innovations and changing user behavior.
Define
Distributional’s workflow begins by walking a user through the process of defining their application’s behavior.
The Distributional platform automatically quantifies AI application behavior off of unstructured data with the Eval Module, which is designed to significantly increase the number of metrics being tracked. You are also able to add your own metrics to this, though it’s not required, so that the platform can provide a more robust quantitative view of the application’s behavior.
Similarly, the Distributional platform automatically assesses similarity using the Similarity Index (Sim Index), which is derived from statistical tests comparing these metrics across experiment and baseline runs and presented as an aggregate value that represents how much behavior has shifted. Distributional also includes a library of a wide variety of statistical tests so you can easily add your own tests or adjust thresholds—either programmatically or with a single click.
Together, these items create your app’s Behavioral Fingerprint. Behavioral because it represents information on AI application status beyond performance, inclusive of a variety of attributes that may be correlated in interesting ways. And Fingerprint because the combination of distributions of metrics that define their status will be unique to each AI application.
The goal of the rest of this workflow is to consistently use information from the other steps to refine the definition of AI app status so it is always consistent with the current state of the AI application as it evolves over time.
Agent use case
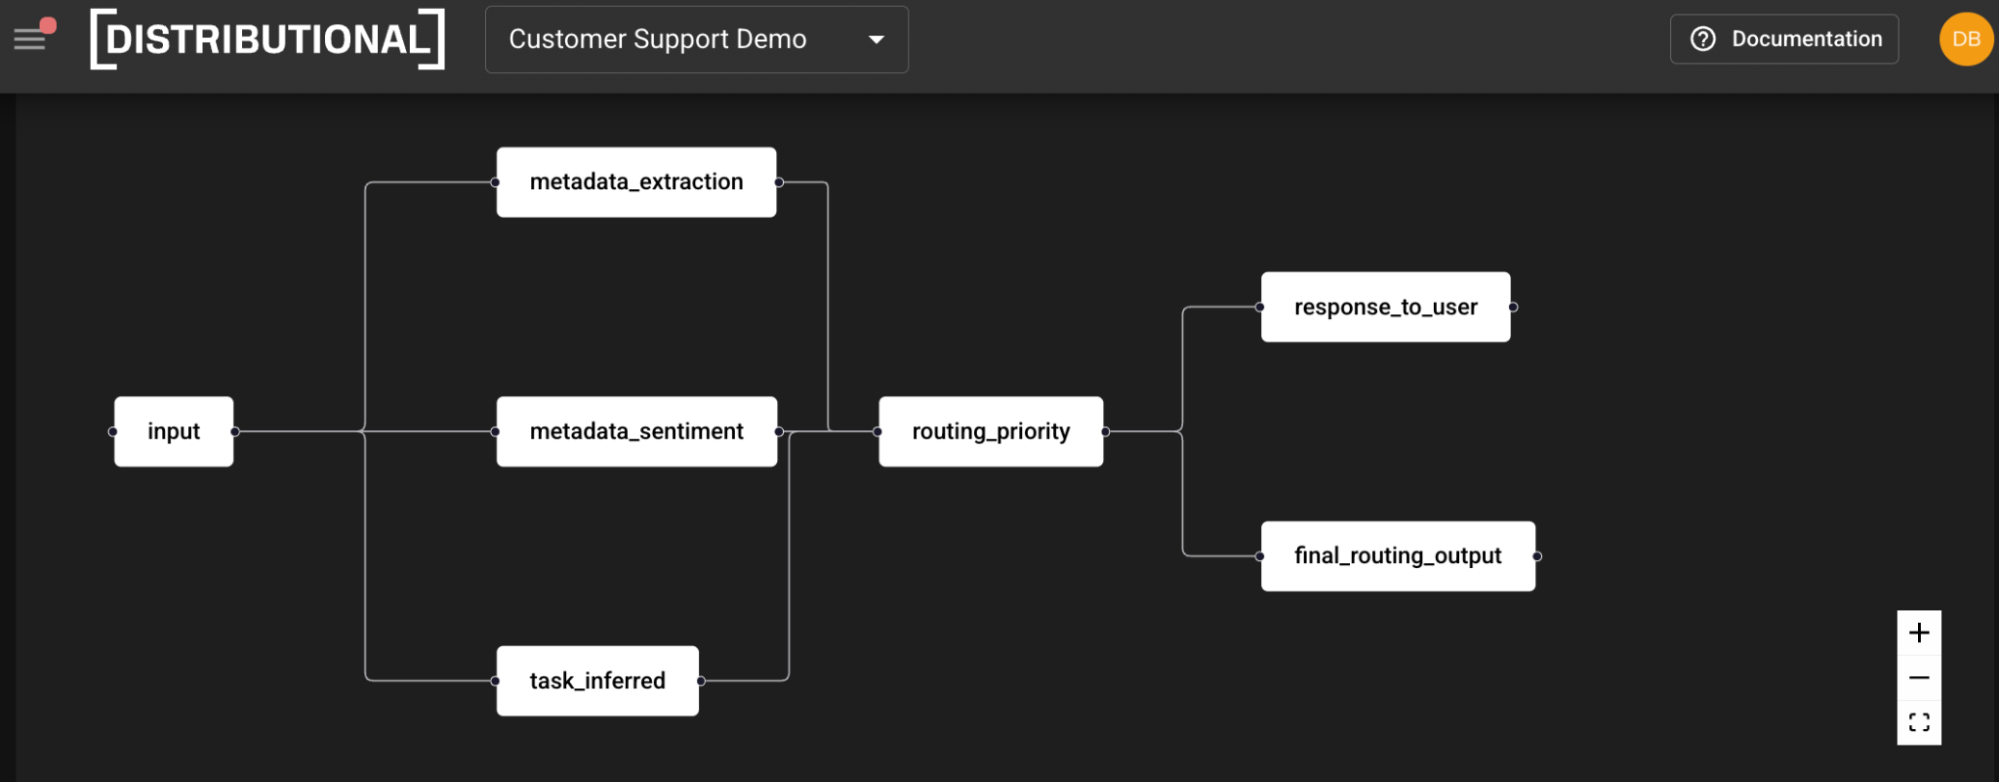
In our use case, the agent receives an input, extracts entities and sentiment from the metadata, infers the task, and then defines routing priority. This routing priority step then dictates the response to the user and the final routing output. (If you are more of a visual learner, you can view the demo video instead.)
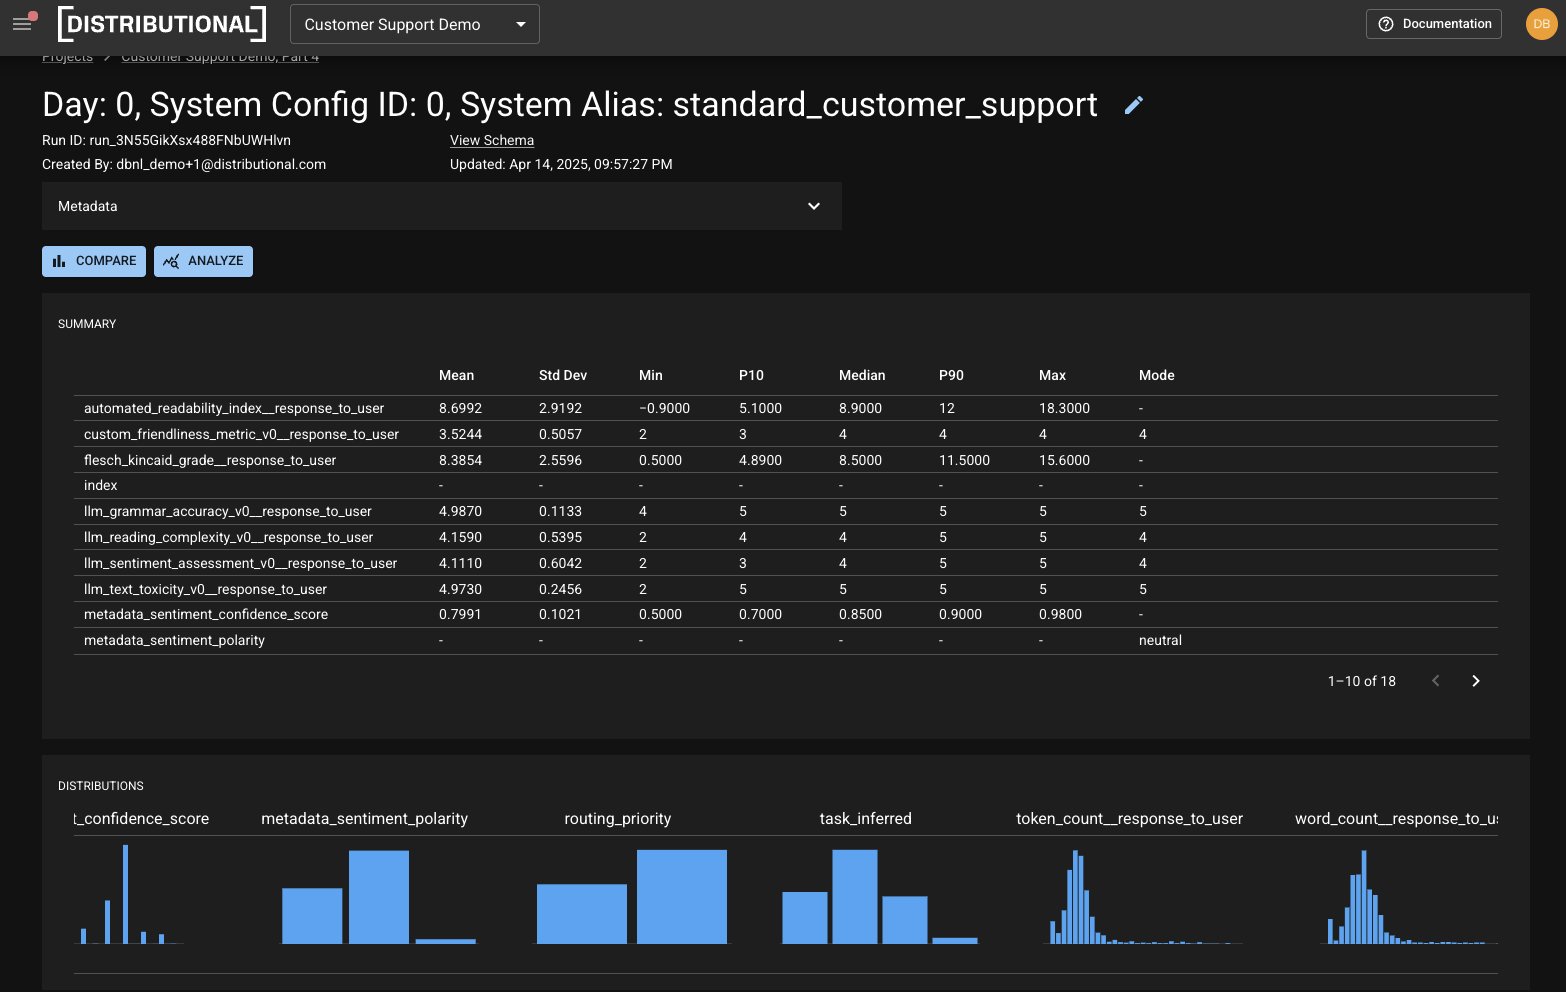
For the response to the user, we include nine metrics, most of which are intended to contextualize whether the LLM output is consistent with expectations. These metrics include automated readability index, custom friendliness metric, Flesch Kincaid grade, LLM grammatical accuracy, LLM reading complexity, LLM sentiment assessment, LLM text toxicity, token count, and word count. This mixes a variety of types of metrics, including statistical metrics, custom user defined metrics, LLM as judge metrics, business metrics, and properties of the underlying data.
For the intermediate steps, we also have four metrics in this example. Although you can catch most issues with assessment of response to user metrics, these intermediate steps metrics make root cause analysis much more streamlined and guided. These metrics include sentiment confidence score, sentiment polarity, routing priority, and task inferred. Below is an example of a variety of these and the representation of summary statistics on each distribution in our product.
Detect
In Distributional, detection is both automated and configurable. The platform automatically applies the Sim Index to detect any change over two points in time for the application as a whole and at the component, column, and result levels so you have an intuitive way to detect and identify where there has been a shift. While the Sim Index comes with a pre-configured threshold, it is easy to adjust so you can minimize false positives or false negatives.
Along with these thresholds, you can configure notifications and alerting on Similarity Indexes or other tests directly within the platform with a few clicks, and customize the notifications so they are aligned with the severity of the change. For example, drastic shifts around tokens or toxicity may warrant a PagerDuty alert, while subtle shifts on output relevance may only require a Slack notification. Learn more about notifications here.
A key tenet of Distributional’s workflow is that detecting shifts will yield new insights on the behavior of your AI application, and that you’ll want to use this insight to further improve the definition of behavior by creating new tests. To support this, it’s easy to set new thresholds or make new assertions in Distributional, either within the dashboard or programmatically through the SDK.
Agent use case
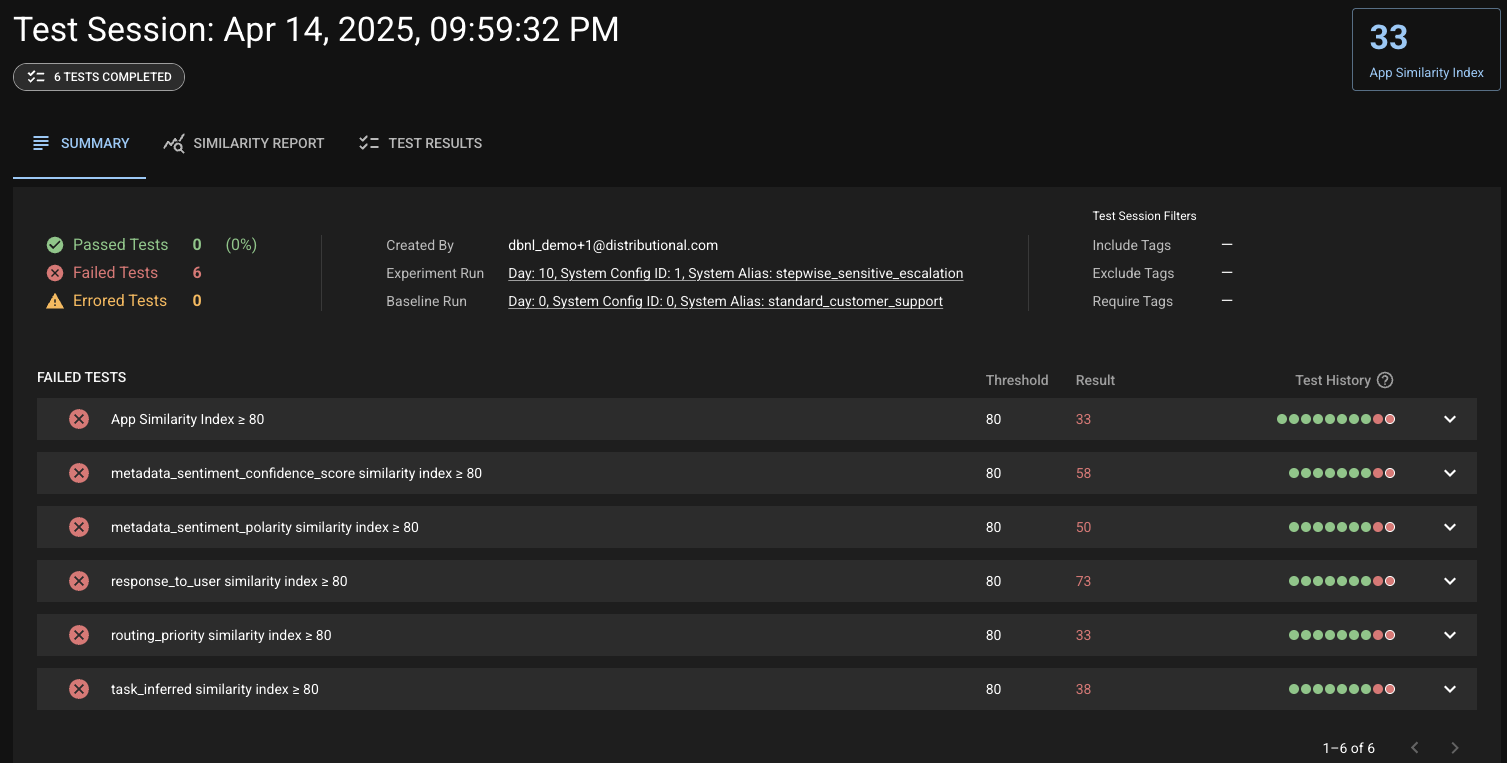
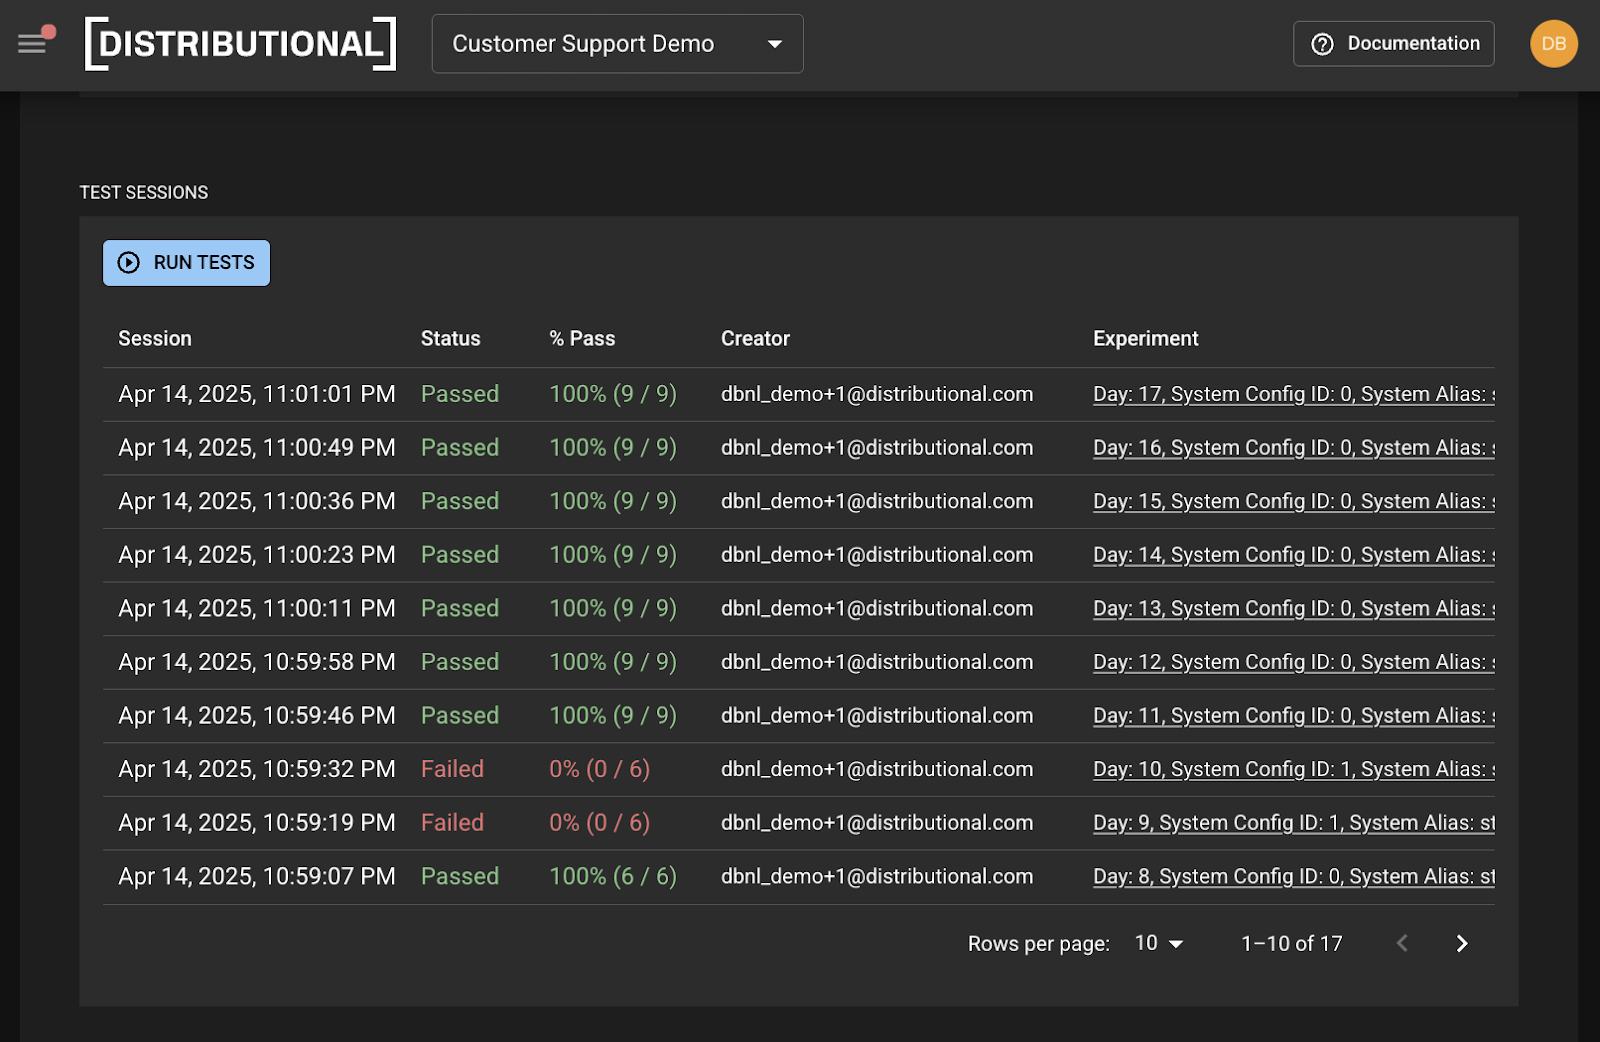
A week into the production application, Distributional identifies a significant change in behavior, as represented by a run-over-run Similarity Index of 33 and is notified which tests failed—in this case, all of them.
Understand
For many AI teams, trying to root cause and debug issues once detected can take hours. Distributional is designed to give you relevant insights on any change as quickly and intuitively as possible so you can do rapid root cause analysis and take appropriate action. To simplify this process, Distributional helps you quickly answer these three straightforward questions:
- Was there a change?
- Where was the change?
- Do I care about the change?
To answer these, you have a few tools available within the platform:
- The Similarity Report provides an overview of all shifts in Sim Indexes at the app and column level, along with a human readable description of the shift. It also enables guided investigation into column specific changes.
- Similarity Insights are automatically produced with every Sim Index and provide human readable insights that represent the most probable causes of the change. These drastically accelerate the ability to root cause any changes.
- Notable Results are specific rows of data that are automatically surfaced for deeper, line-by-line review during investigation.
These features are paired with correlations, comparative analysis, and an array of visualizations designed to guide your understanding on the change. Additionally, you also have the full history of data for all components in your AI system (with admin configurable access controls and permissions), so you can go as deep as you want, and share the information with other teams for collaboration on any action that you take to resolve the issue or improve the AI app.
Agent use case
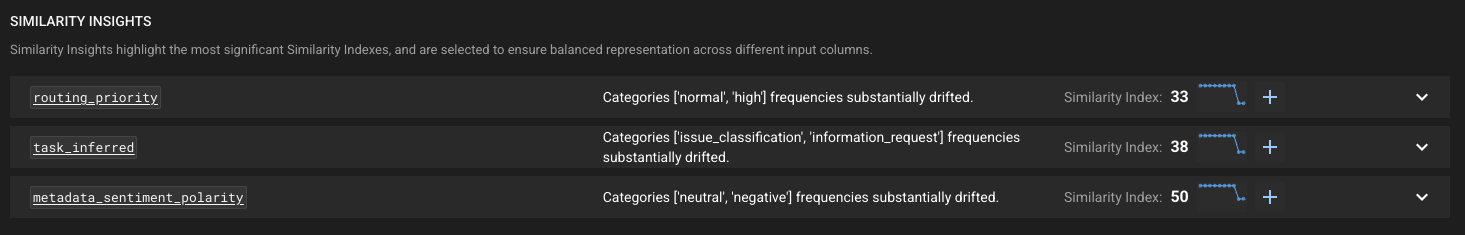
First, Distributional provides Similarity Insights that immediately offer the user guidance on what most likely caused the change. In this case, routing priority is served up as the metric to analyze first.
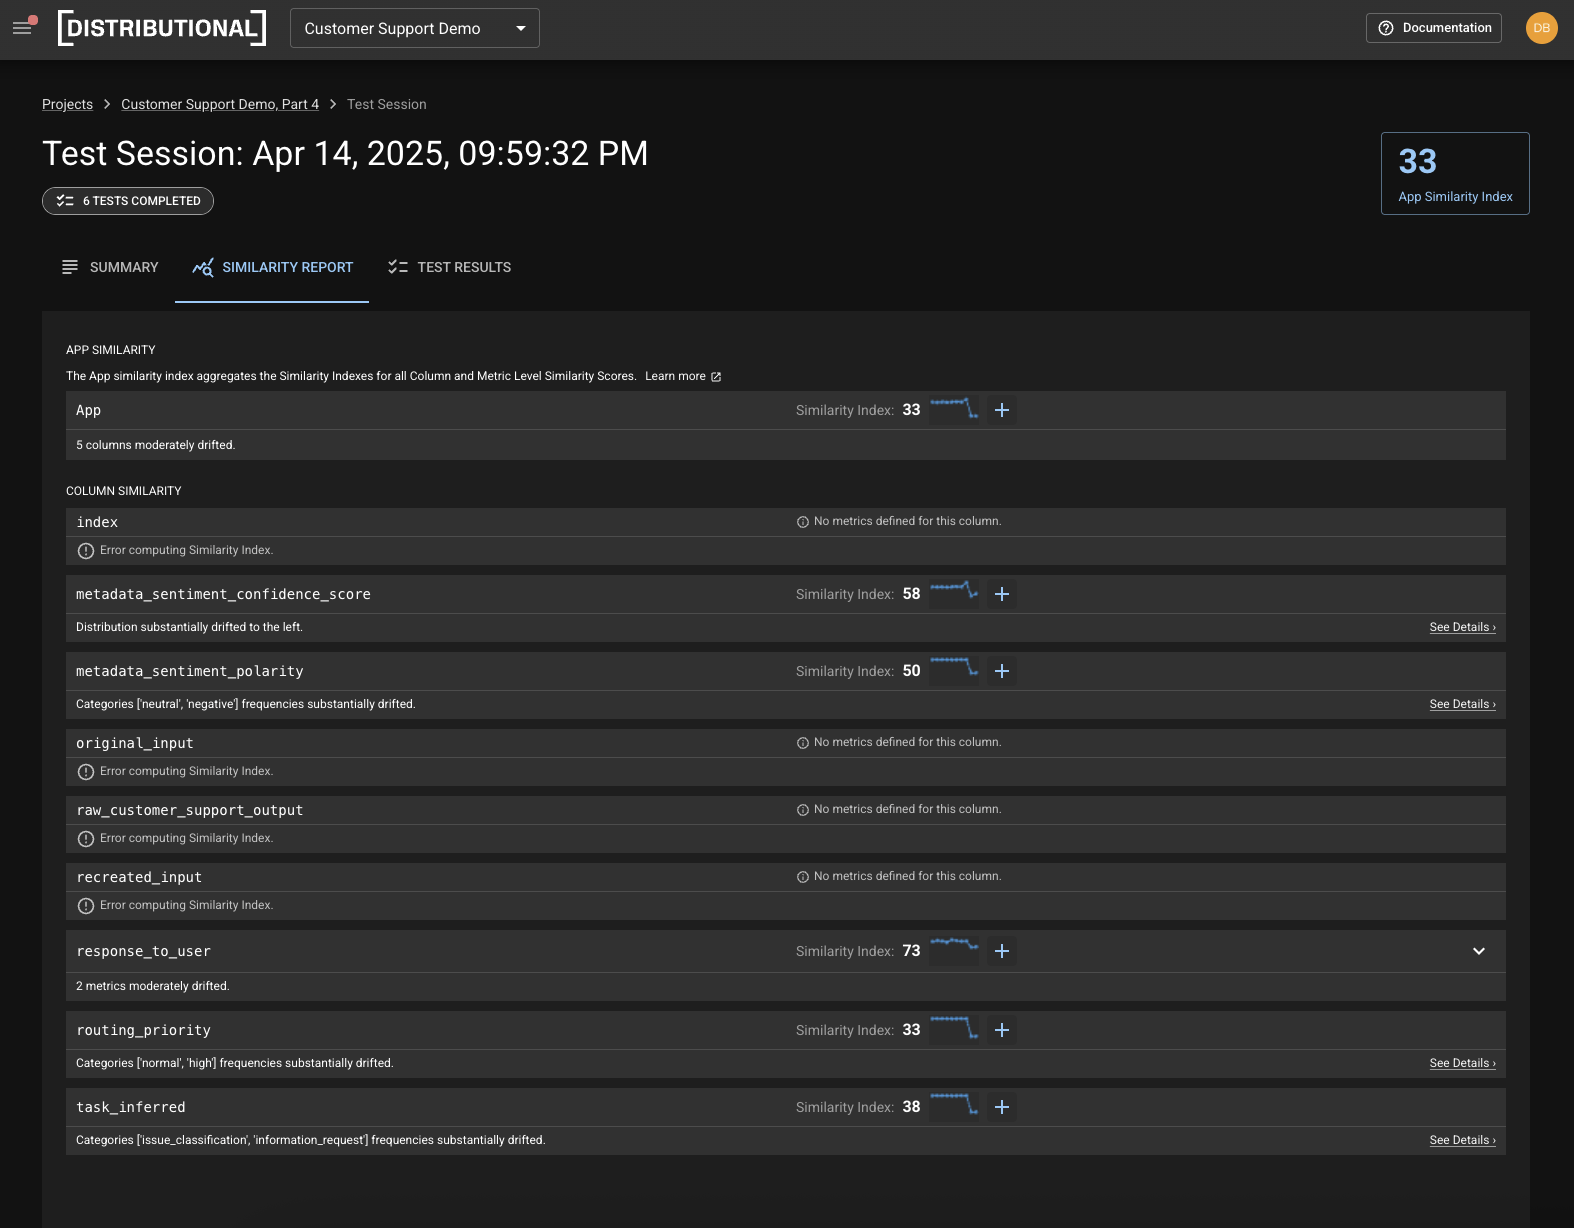
Second, Distributional offers a Similarity Report to see these Similarity Insights in context of everything that has changed to get a full picture of how the metrics have varied over time. Again, this Report suggests looking at routing priority first, but also contextualizes this by denoting that task inferred also experienced a significant shift as well.
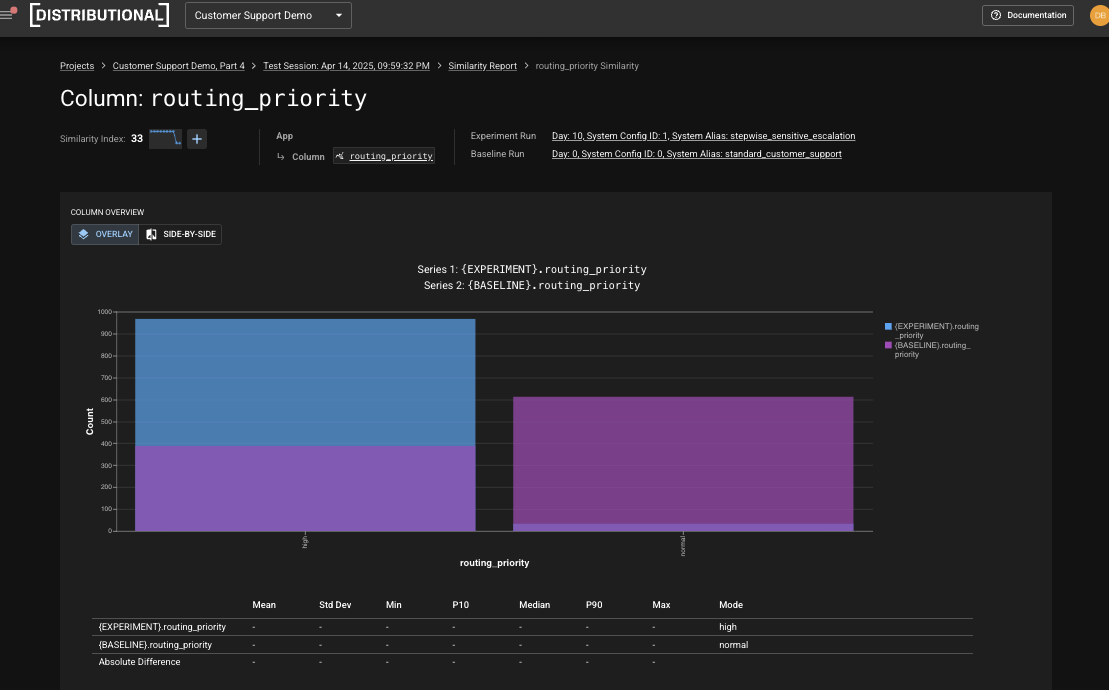
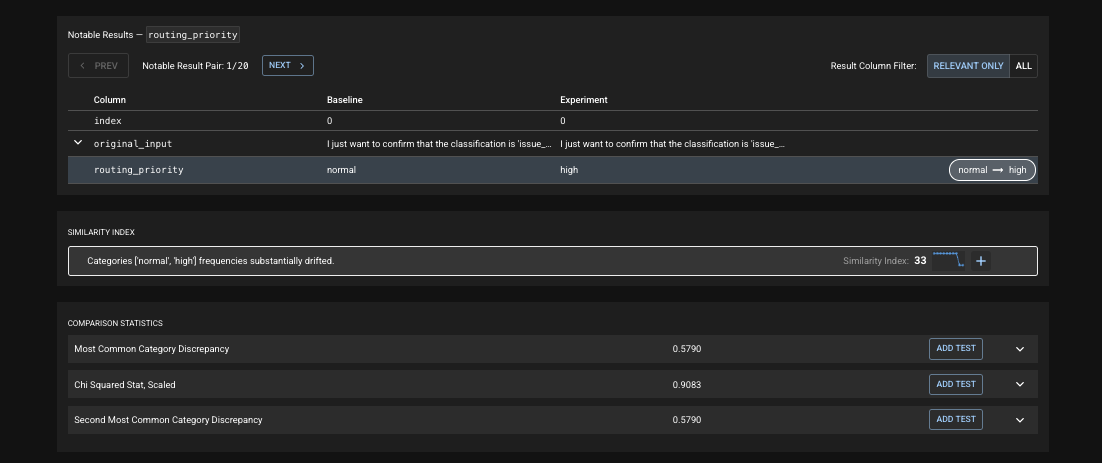
Distributional then offers up comparative analysis and other visualizations of these distributions to help you understand what has happened. In this case, it is obvious that the routing priority has shifted to have a much higher propensity of high routing priority inputs.
Finally, Distributional then provides specific Notable Results—rows of data to be analyzed that most contextualize this change. This shifts data review from random sampling guesswork to targeted, precise review of specific prompt-response pairs that need attention. In this case, it is quickly obvious that the same responses are generating wildly different routing priority.
Improve
One of the most powerful parts of this workflow is the ability to continuously improve your AI application over time.
This can be in the form of a single click to create a new test on a metric that you discovered had a certain behavior you want to track. Or it could be selecting rows of data the platform surfaces through Notable Results and building these into your golden dataset for future development. In other instances, it could be providing a dashboard report to governance teams for approval to scale to new segments or users after certifying behavior through the tests being run. Finally, teams will often rely on Distributional for continuous app development (such as refactors, upgrades, or otherwise) to ensure that any development won’t fail this collection of tests that define “desired” AI application behavior.
In all cases, the Distributional platform is designed to flexibly fit into whichever version of this workflow you have put in place for your team.
Agent use case
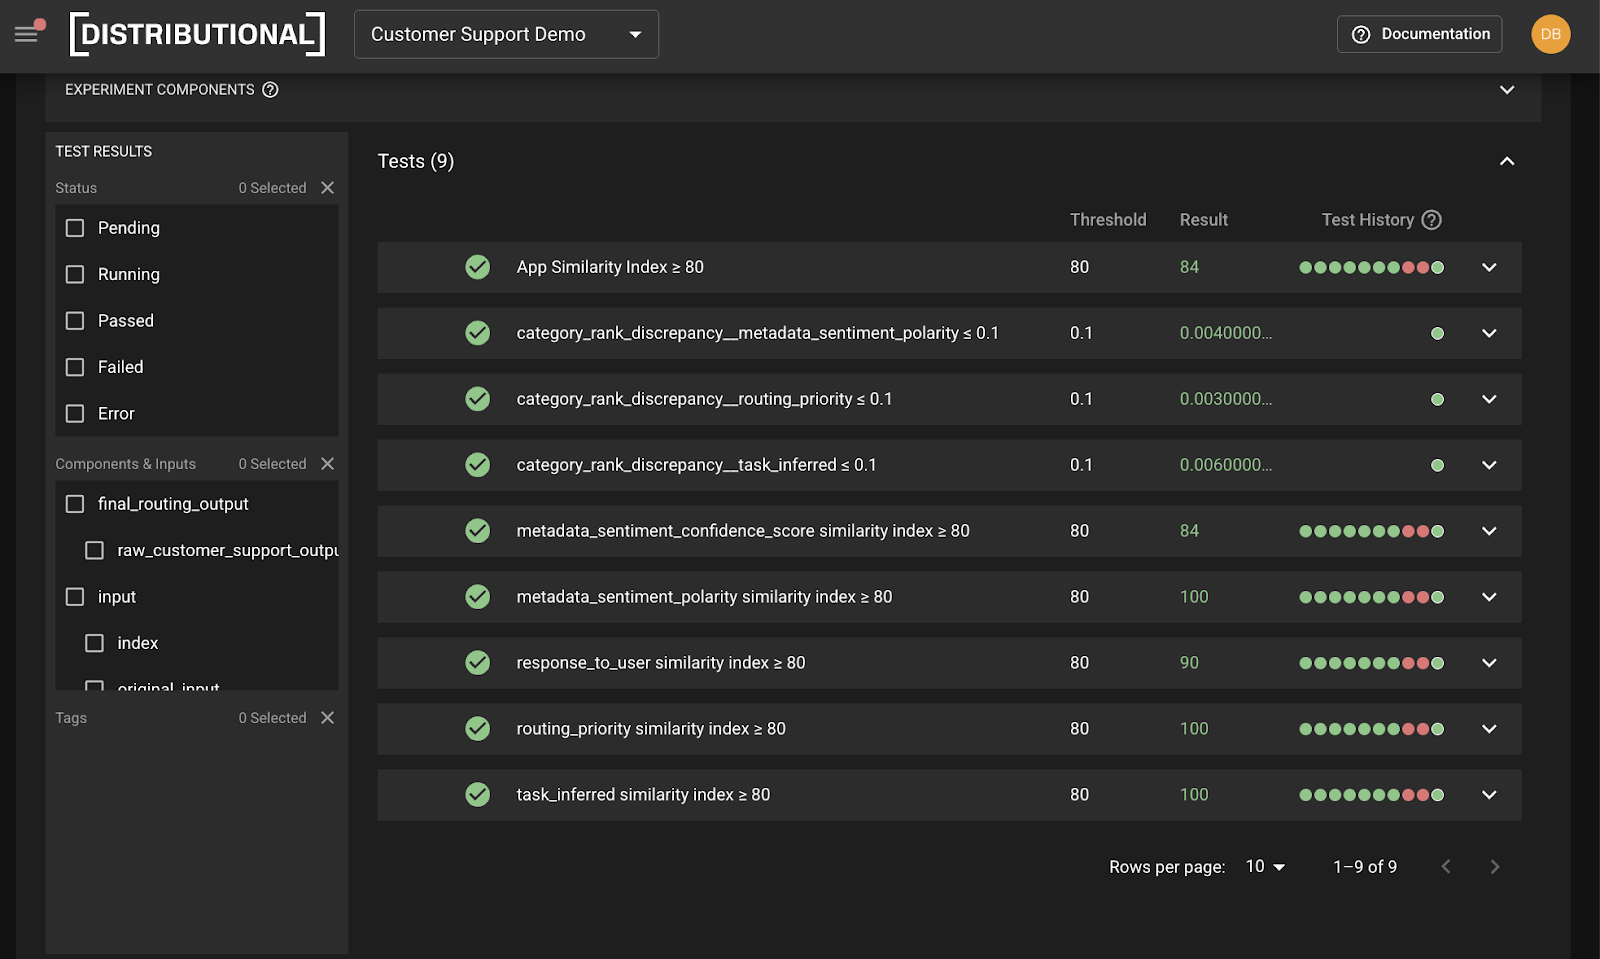
With the direction that Distributional offers, this team discovered a change in the prompt template that drove this shift in behavior, and were able to resolve it. They re-ran tests to confirm this fix passed their set of statistical tests that defined good, performative AI application behavior.
Similarly, they were able to add three new tests guided by the Distributional platform that represented a more rigorous threshold and definition of behavior they wanted to track. In this case, this included new discrepancy tests for sentiment polarity, routing priority, and task inferred so they could be notified regarding deviations in the future.
Result
This use case showcases the value propositions in the user experience. First is the value of Distributional’s automation in streamlining the process of defining AI application behavior and writing tests to check this behavior over time. Second, the Distributional platform provides intelligent recommendations for what is causing any change that simplifies the root cause analysis process. Finally, the platform serves as a system of record for all tests and analysis so teams can reproduce what happened and share it with third parties.
While this is just one use case, this is meant to give you a sense of the range of areas where you’d gain insights with Distributional. No matter what your app looks like, Distributional’s goal is to give you a consistent way to assess and analyze each of these components.
Learn more
Distributional aims to provide an intuitive experience for understanding what, where, why, and how your AI applications are changing over time, so you can use this information to guide continuous development. For a deeper dive into the Distributional workflow, check out the downloadable paper on Distributional’s User Experience.
Subscribe to DBNL
Thank you for your submission!
Oops! Something went wrong while submitting the form.